It is possible to drag a column from the table to the Group Panel section to group by that column. To do this, drag the selected column header and place it in between the toolbar and the table. You will then be able to group by that column.
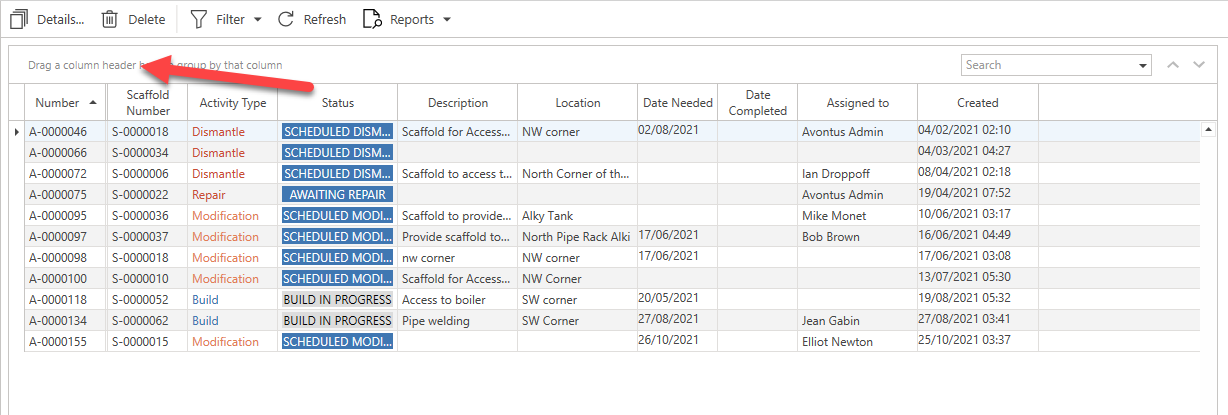
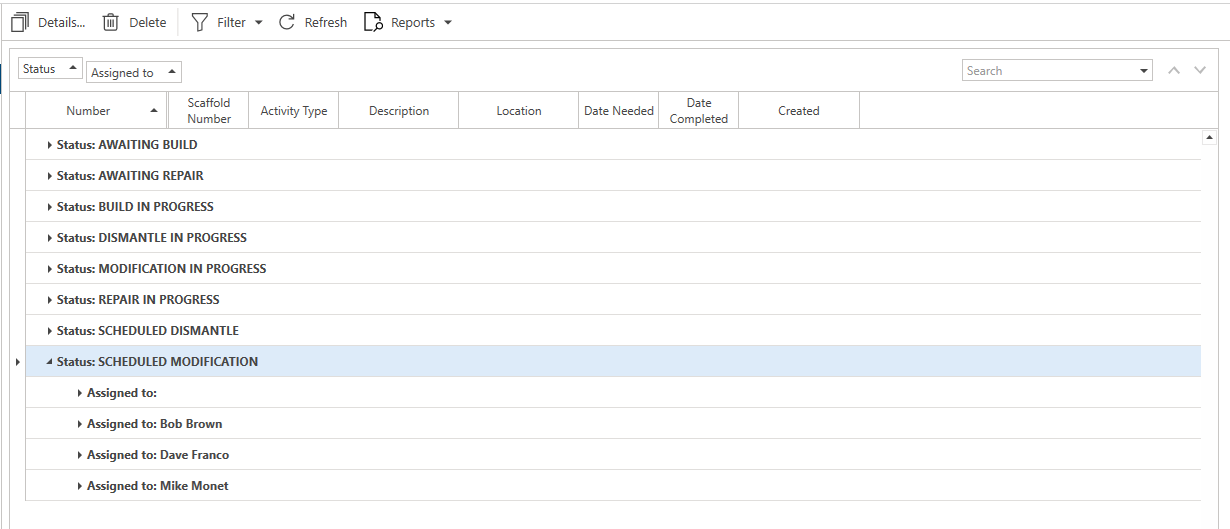
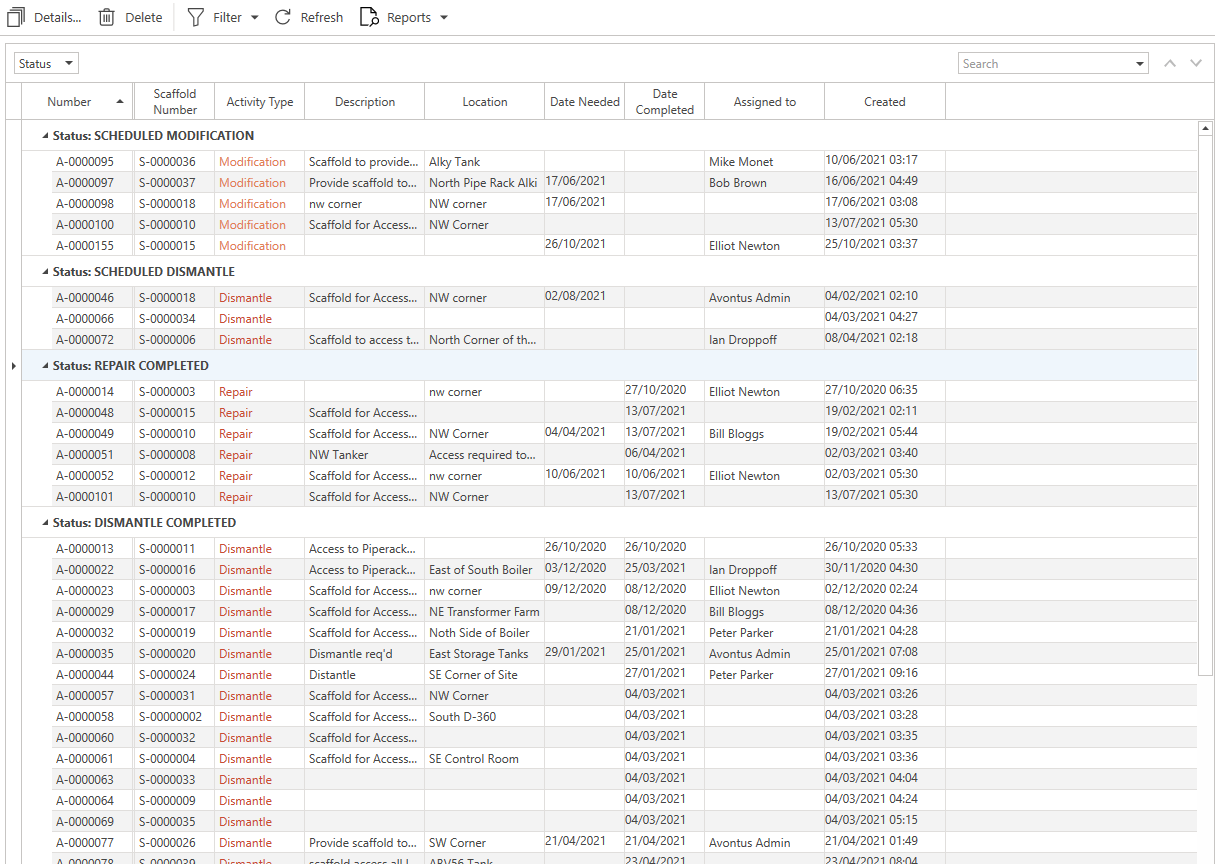
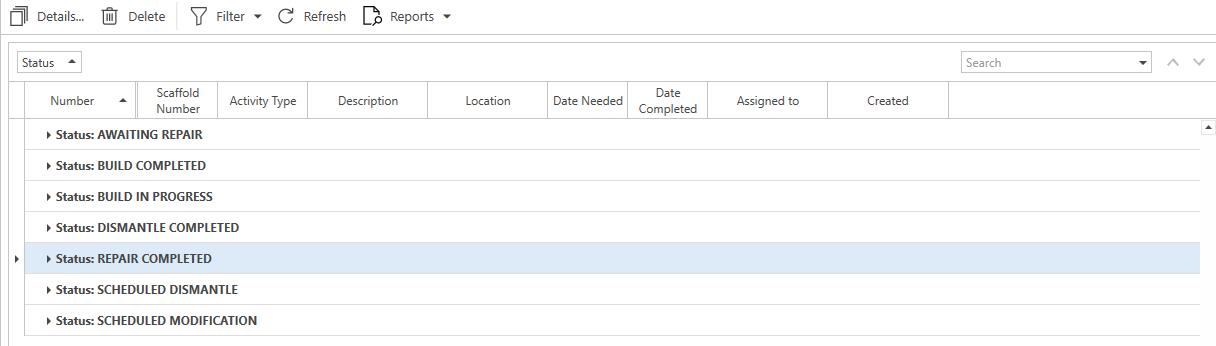
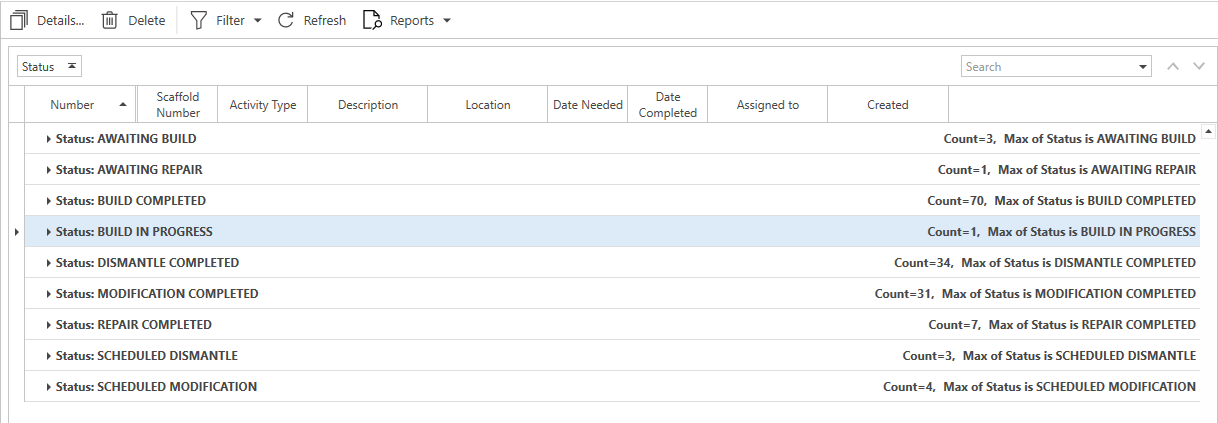
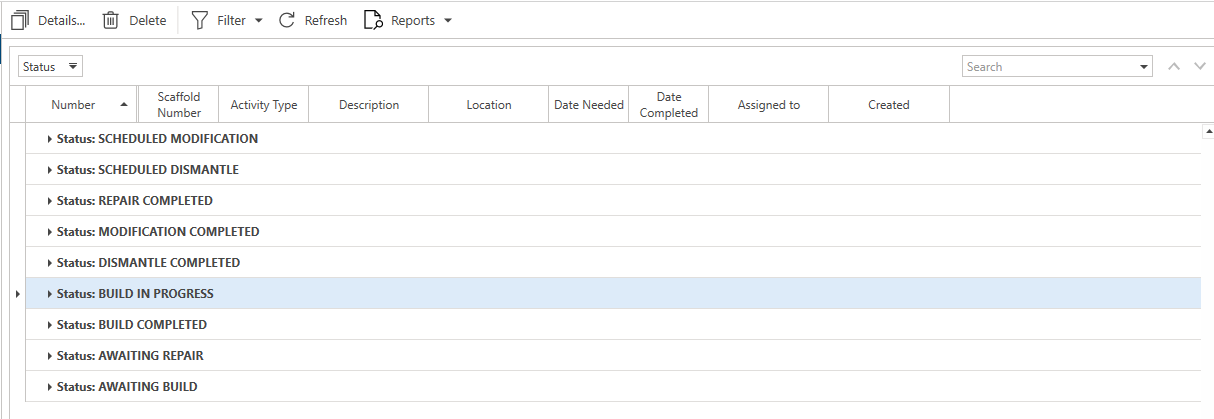
When you group by a column, each unique entry in the column will have its own group. Each entry will be given its own group as shown below.

Note: You can group by two columns by dragging a second column to the column panel.
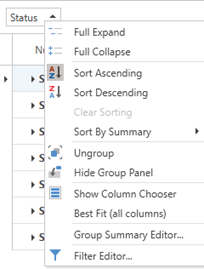
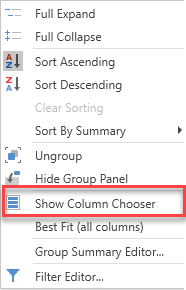
By right-clicking on the grouped column, you can modify how the information is displayed in the table below.
Full Expand
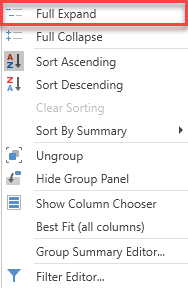
Expand all entries in the table to show further information for each group.
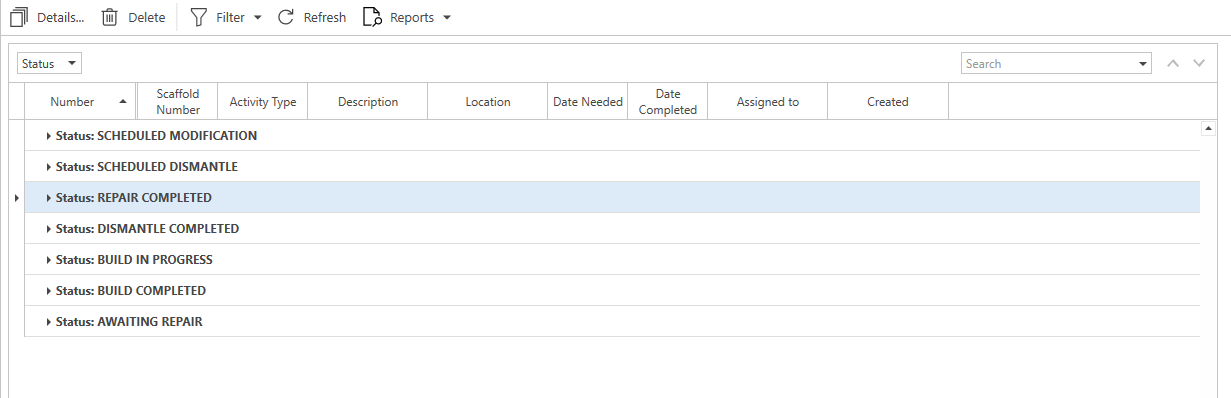
Full Collapse
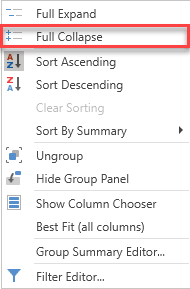
Collapse all groups in the table.
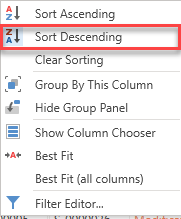
Sort Ascending
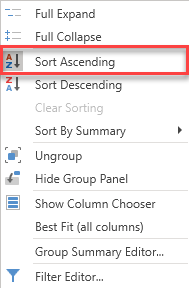
Sort the groups in ascending order alphabetically or numerically.
Sort Descending
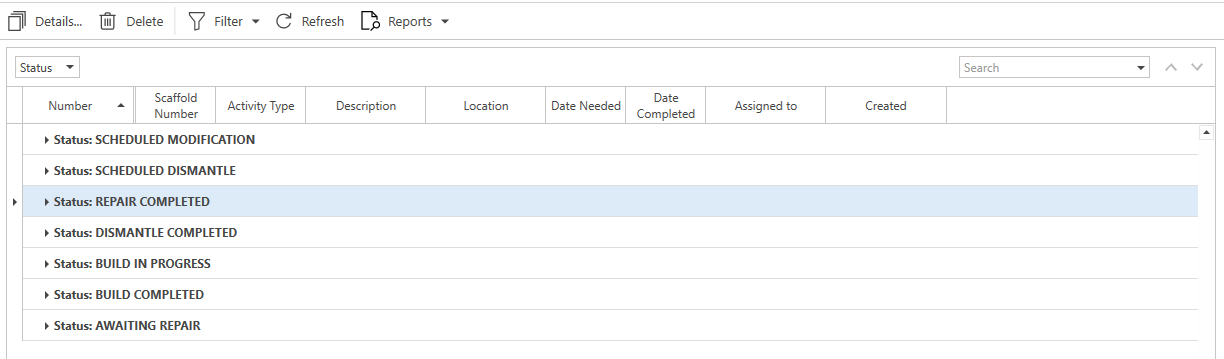
Sort the groups in descending order, alphabetically or numerically.
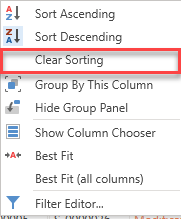
Clear Sorting
Clear any column sorting currently active.
Clear Summary Sorting
When sorting by summary (see below) clear any column sorting currently active.
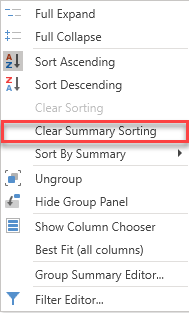
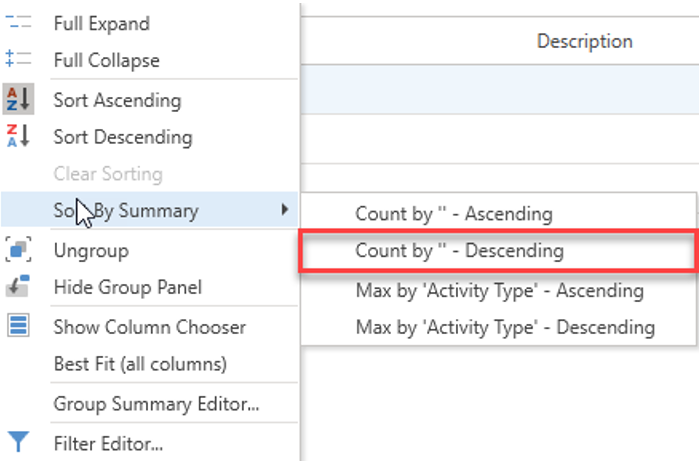
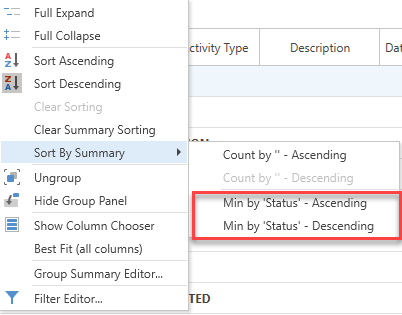
Sort by Summary
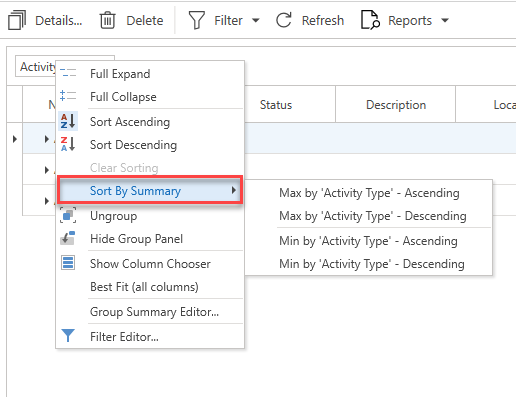
A summary is a brief overview of what content is held within that group. This summary contains information about that group such as the number of rows within that group and the maximum or minimum entry in a group from a selected column.
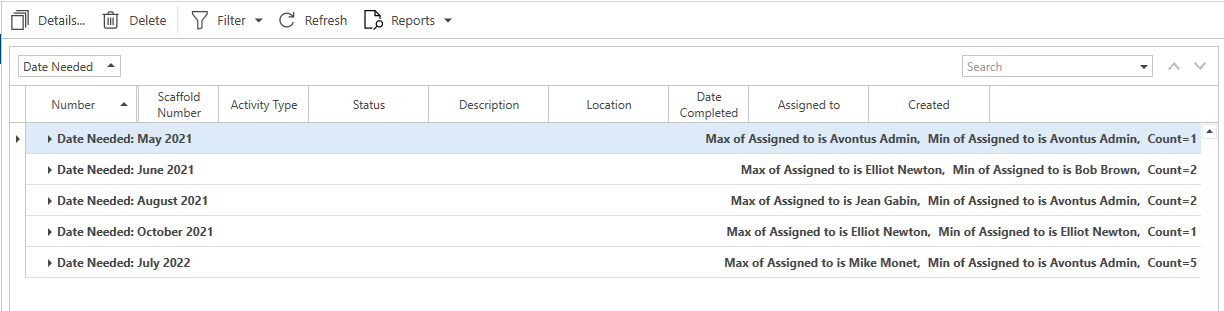
For example, when grouping by Activity Type, you could select to display information from the Assigned to column for each group. The summary would then provide an overview of the data pulled from the Assigned to column including the number of entries in each group and the minimum and/or maximum status of each group.
All this is set up in the Group Summary Editor where you can define which column to pull information from and display in the summary.
Group Summary Editor
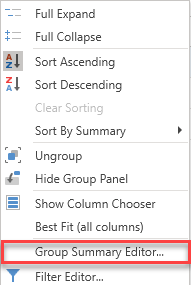
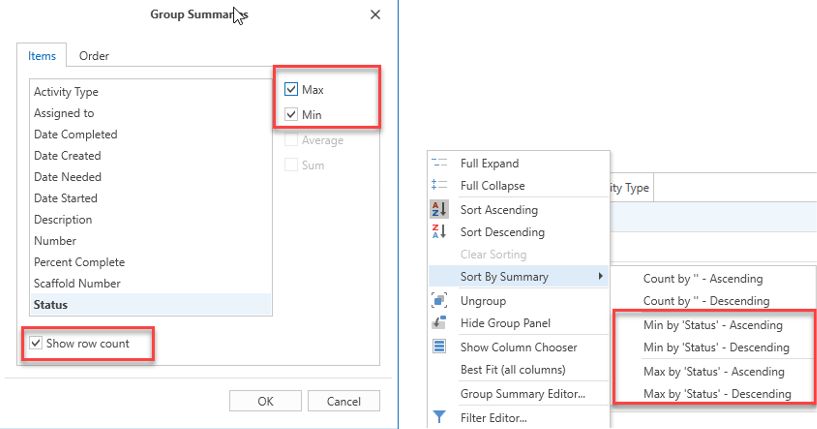
When grouping, this option allows the user to adjust what is displayed in the group summary, such as the maximum and minimum value within that group and the number of rows within the group.
To the left-hand side is the columns and to the right are the summary options. Select a column on the left and this will be the column where the information is pulled from.
Selecting Max and Min will enable Max by Ascending, Max by - Descending, Min By Ascending, and Min by Descending summary options for the chosen column.
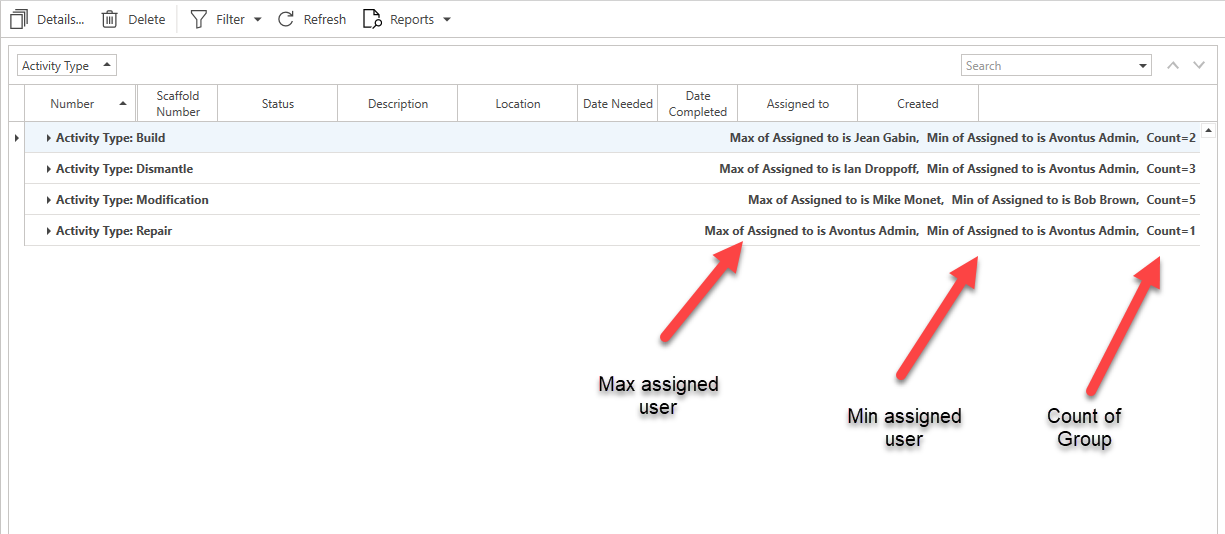
In the example below, the maximum and minimum status of the group will be displayed for each group.
Click the Show row count to enable a count for the number of rows within the group.
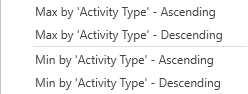
Note: The Max by Status summary options will change depending upon the selected column. For example, selecting Activity in the Group Summary Editor will set the summary option to Max by Activity Type.
Click OK and the table will display the summary of each group detailing the maximum or minimum Status of an activity for that group.
Note: You can summarise the average and sum of a column for each group. These columns will be available on numerical columns such as scaffold height and scaffold base elevation.
Order
The Order tab of the Group Summary Editor allows the user to modify how the summary is presented.
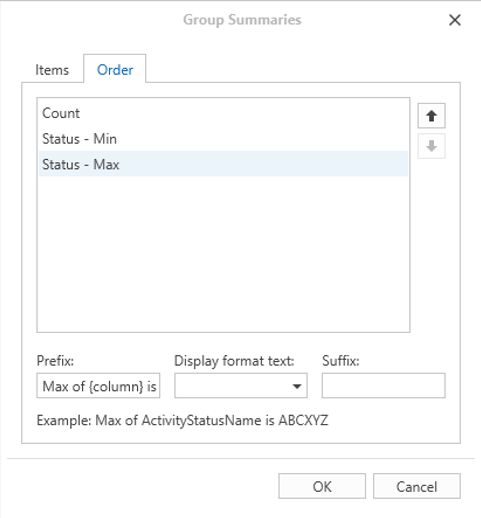
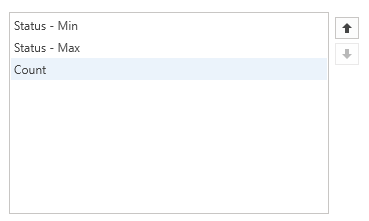
The box in the middle lists the columns you selected in the Items tab. You can use the arrow buttons to the right to adjust the order in which the summaries are displayed.
If you selected to display the summaries as defined in the image above, then the group summary will appear like so in the main table.
![]()
The Prefix, Display format text, and Suffix options allow the user to adjust the wording of the summary.
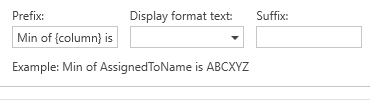
Prefix is the text before the maximum/minimum displayed content for the group.
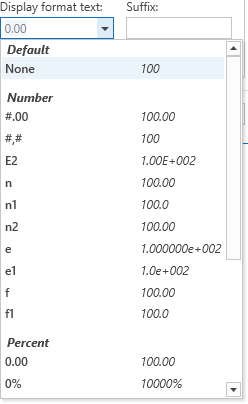
Display format text is used with the group row count and this adjusts how the numbers are displayed.
The Suffix is the text that goes after the maximum/minimum displayed content for the group.
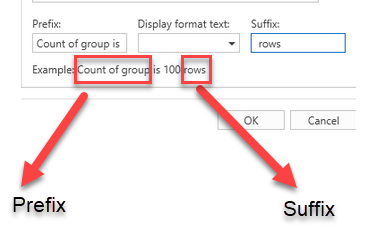
Using the settings above will display the row count like so:
![]()
Note: Make sure to include a space at the end of the Prefix and the start of the Suffix.
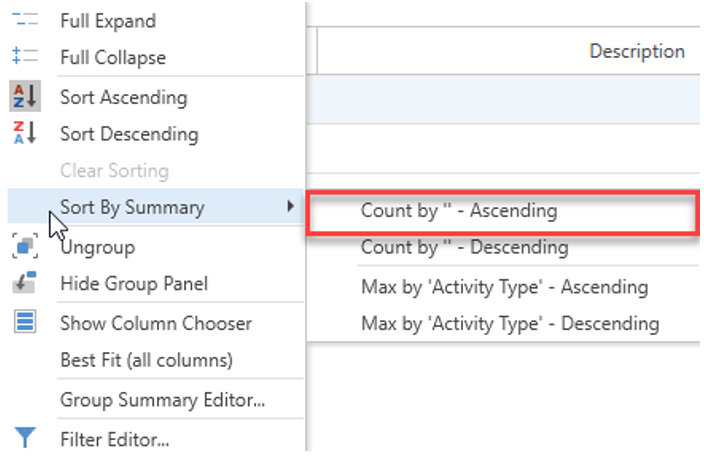
Enabling the Show row Count option and selecting a column in the Group Summary Editor will then reveal the following Sort by Summary options.
Count by Ascending
When grouping, count the number of entries in a group and sort by ascending order. In the example below, the groups are ordered based on the number of rows in the group.
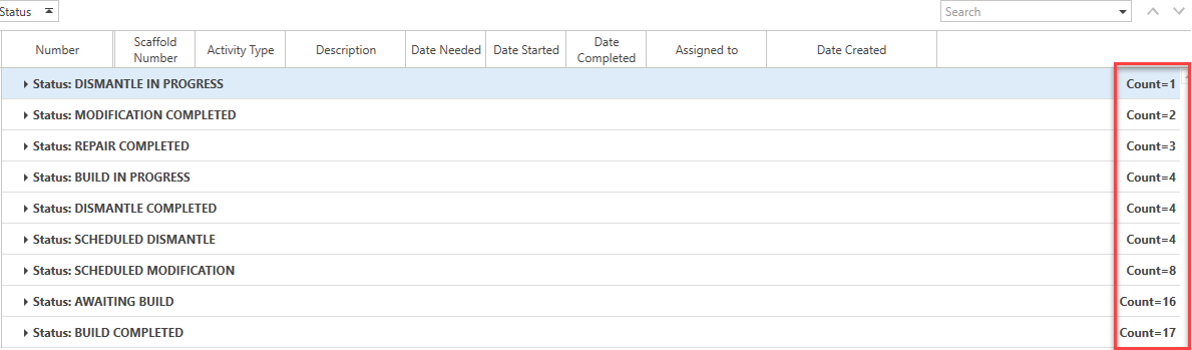
Count by Descending
When grouping, count the number of entries in a group and sort by descending order. In the example below, the groups are ordered based on the number of rows in the group.
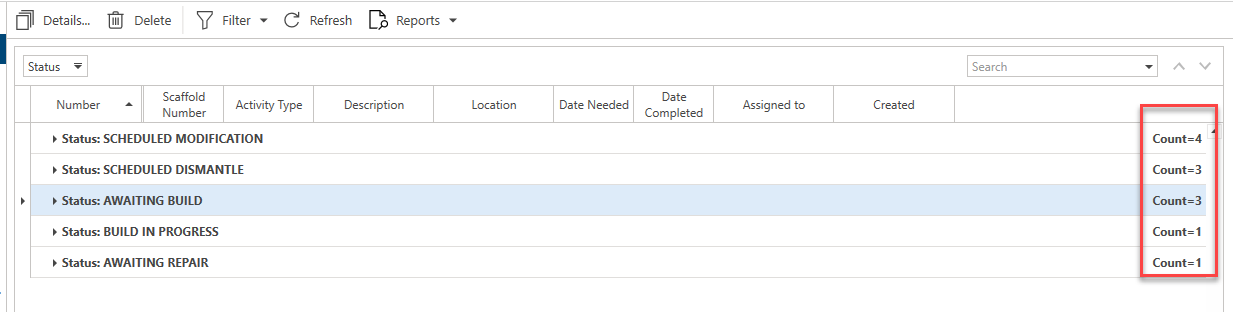
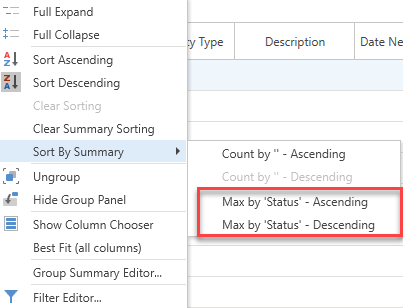
Max by Ascending/Descending
When grouping, this will count the maximum number of each entry of the selected column in a group and sort by ascending order by the status. In this example, we are displaying a summary of the maximum Status per group.
This will then order the groups alphabetically via the Status.
Note: This sort by option is available when the Max, Min, Average and Sum settings are enabled in the Group Summary Editor. For more information, see the Group Summary Editor section below.
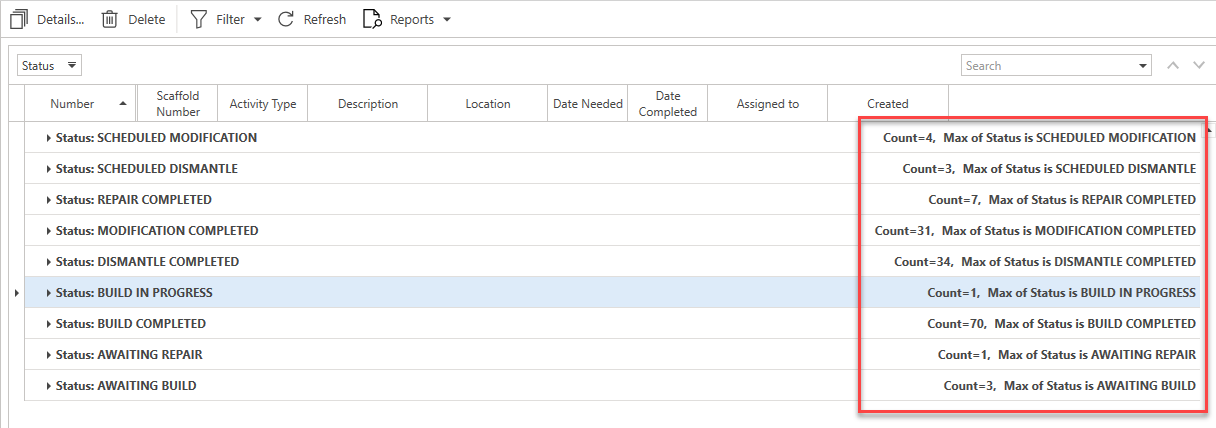
Min By Ascending/Descending
When grouping, this will count the minimum number of each entry of the selected column in a group and sort by ascending or descending order. In this example, we are displaying a summary of the minimum Status per group.
This will then order the groups alphabetically via the Status.
Ungroup
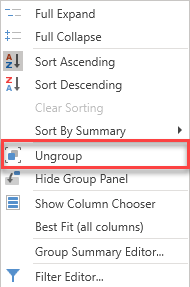
Move the grouped column back to the table.
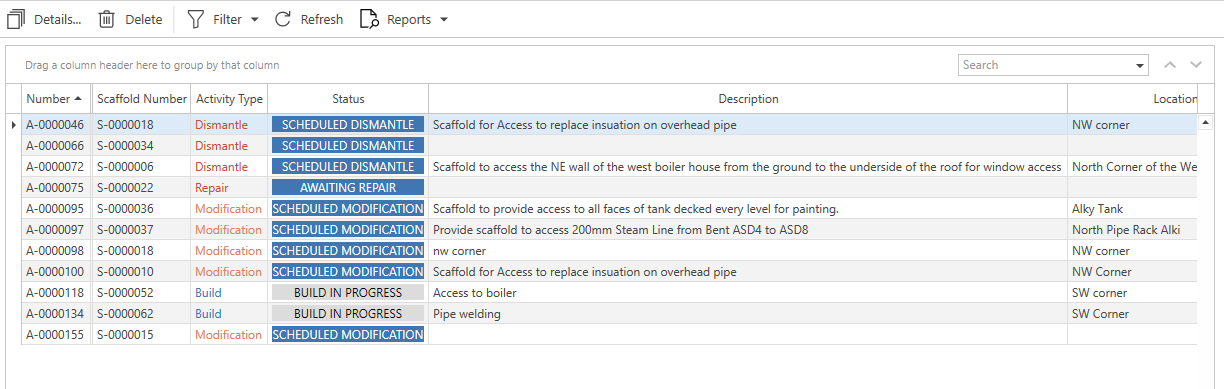
This is what the Activity screen looks like when grouped.
This is what the Activity screen looks like when ungrouped.
Hide Group Panel
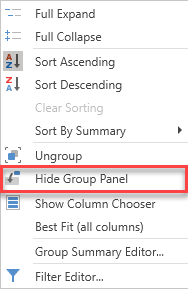
Hide the group panel. Hiding the group panel means you will be unable to group by a column.
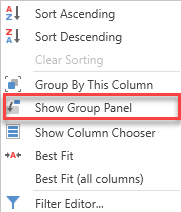
Note: When hiding the Group Panel, you can select to show the Group Panel. Right-click on a column name and select Show Group Panel.
Group Interval (available on date fields only).
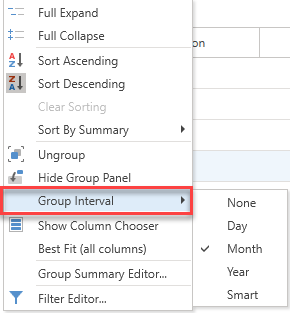
This is for date columns only and allows a user to group by daily, monthly, or yearly intervals. The below example is grouped on a monthly basis.

Smart Interval groups the dates into a different format where the groups are split over a time period of a month (or older) and a week ahead. It allows for increased variance in your groups.
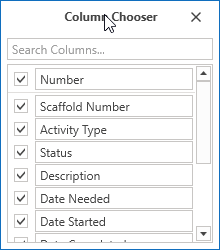
Show Column Chooser
The Column Chooser allows the user to specify which columns to display in the table. This allows you to reduce (or increase) the amount of data displayed on the table so that you can show, at a glance, can see relevant information for yourself.
To enable/disable the column, select the checkbox of the relevant column.
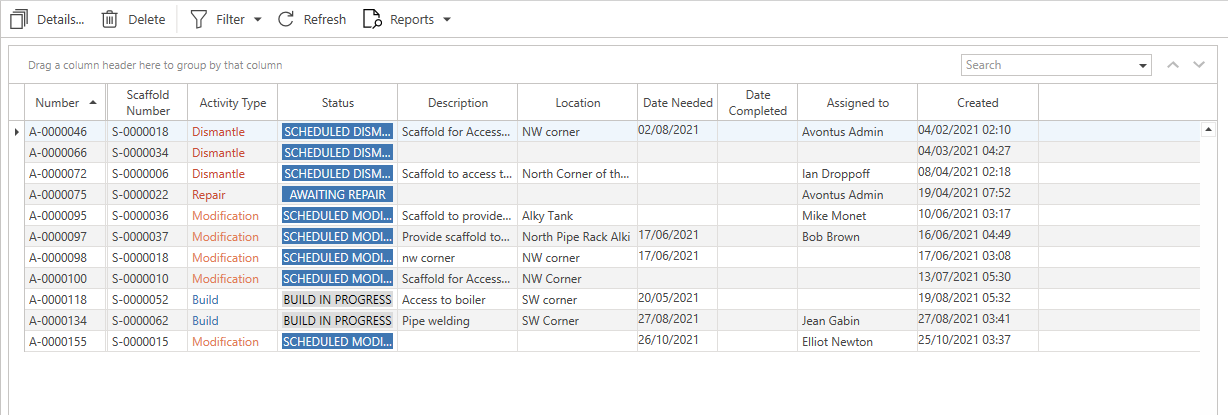
For example, you can specify to show only the select columns below.
Selecting to display these columns will mean only these columns will be displayed in the table.
Best Fit
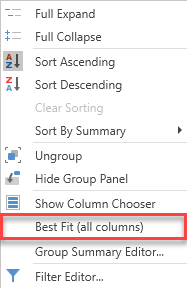
Size all columns to best fit the content within these columns. This will widen columns with a lot of content, such as the Description column.
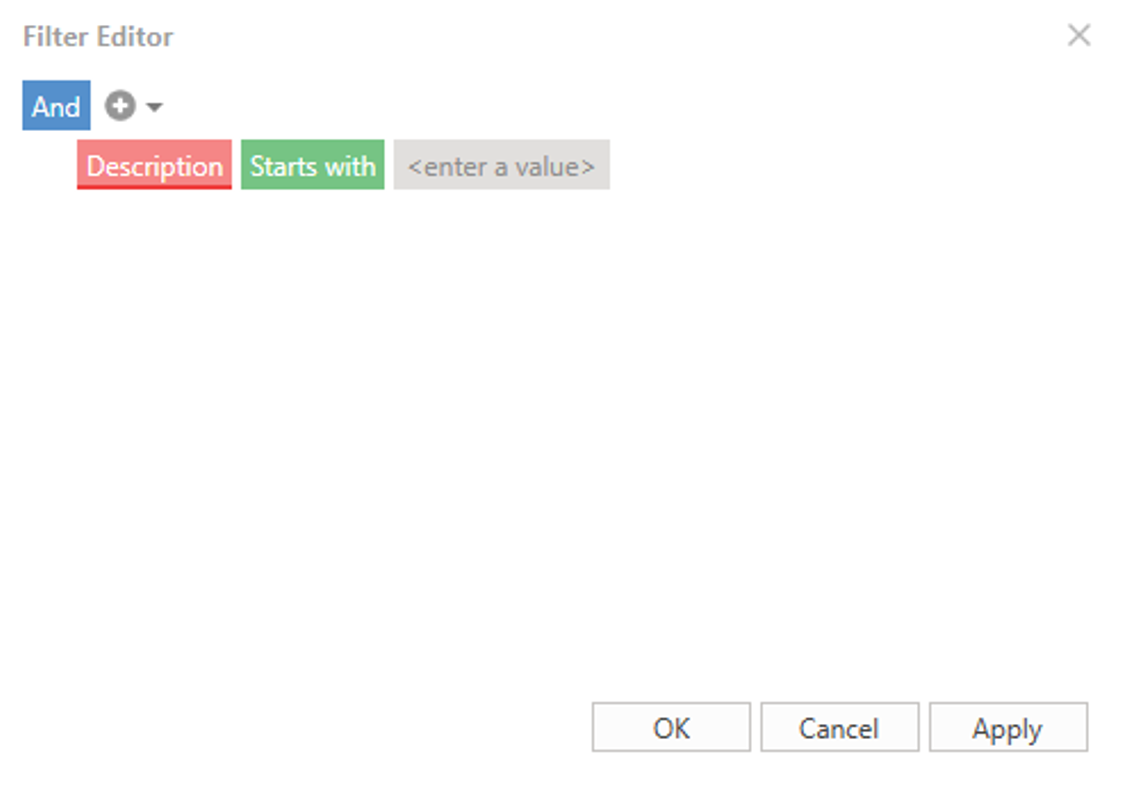
Filter Editor
The Filter Editor uses conditional formulas to select the display data. The conditions for formulas are selected by clicking the And button and then the +.
For more information, please see /wiki/spaces/ADH/pages/2323137013