Quantify Web enables you to configure a Shipment pivot report and save it as an Excel spreadsheet and a PDF document. Even though you are working in a web browser, you configure the report in the same way as if you were working in the Quantify interface.
Accessing the Shipment Pivot Report
To access the Shipment pivot::
- Click the appropriate Job Site, then click the Shipment Pivot tab.
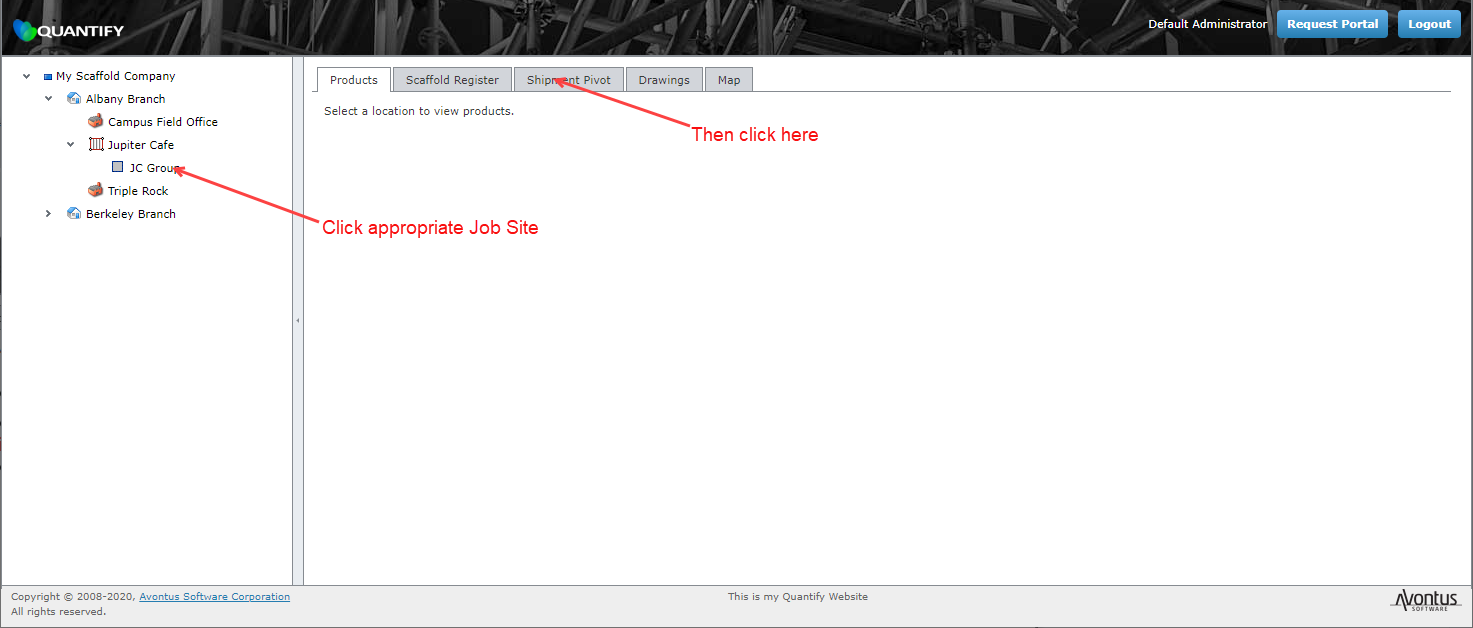
The Quantify Web interface refreshes, displaying the Shipment Pivot page.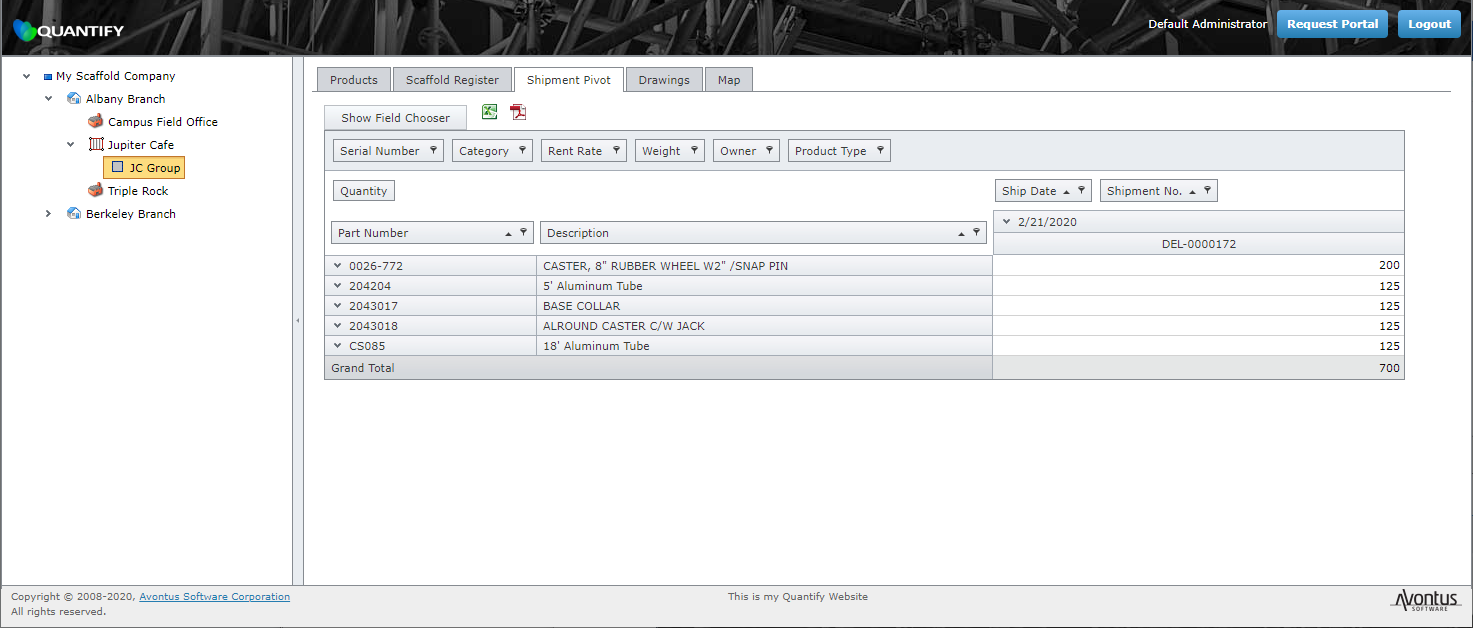
- Configure the report as appropriate.
For information about configuring pivot reports, refer to Creating and Managing Pivot Reports.
Adding a Field To/Removing a Field From a Report
Just like the pivot reports in Quantify, Quantify Web enables you to add add new fields to the Scaffold Register pivot report and remove existing fields from it. If you remove a field, you can replace it whenever you need it.
To add a field to/remove a field from a report:
- Click Show Field Chooser.
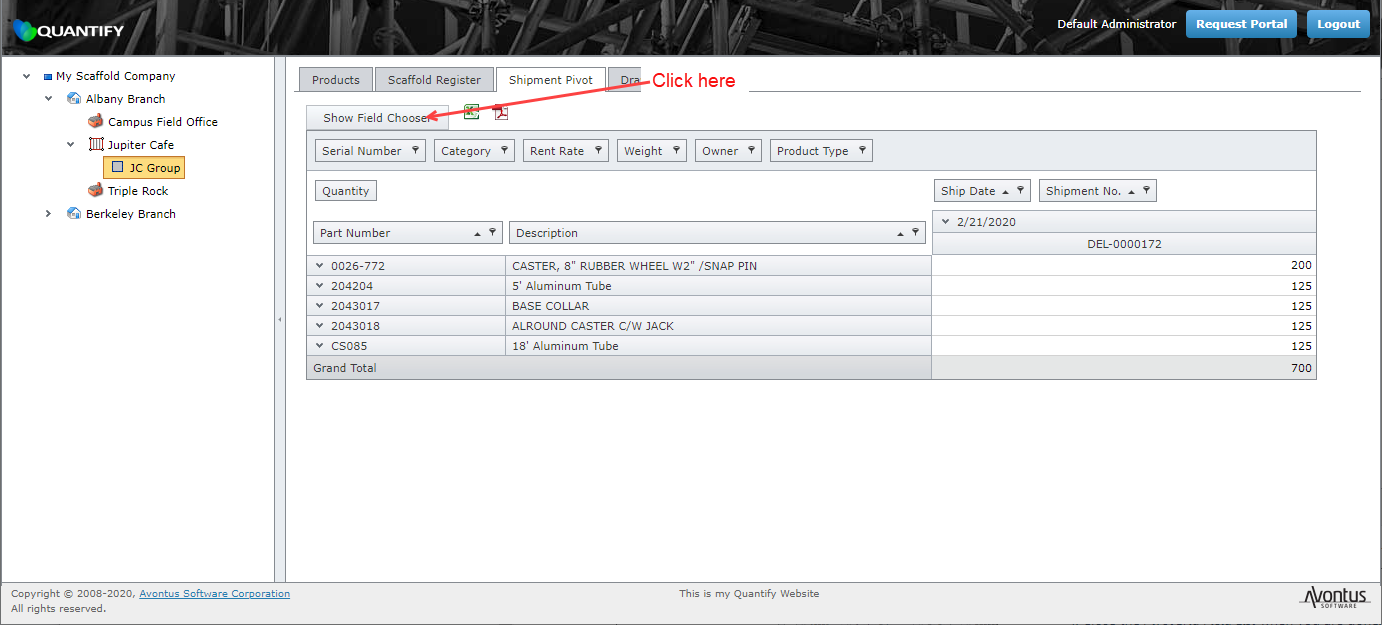
The PivotGrid Field List appears. - Click the appropriate field and drag it into the Filter Header area.
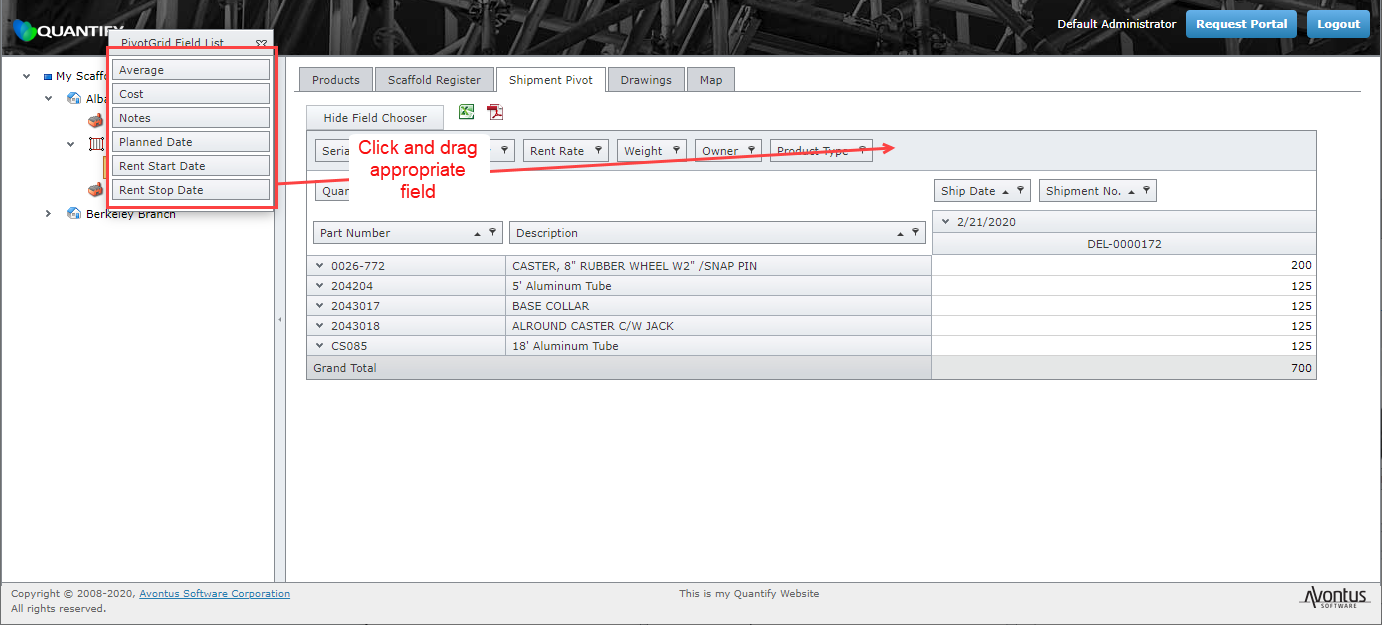
- Repeat the last step as necessary.
To remove a field, click on the field and drag it into the PivotGrid Field List.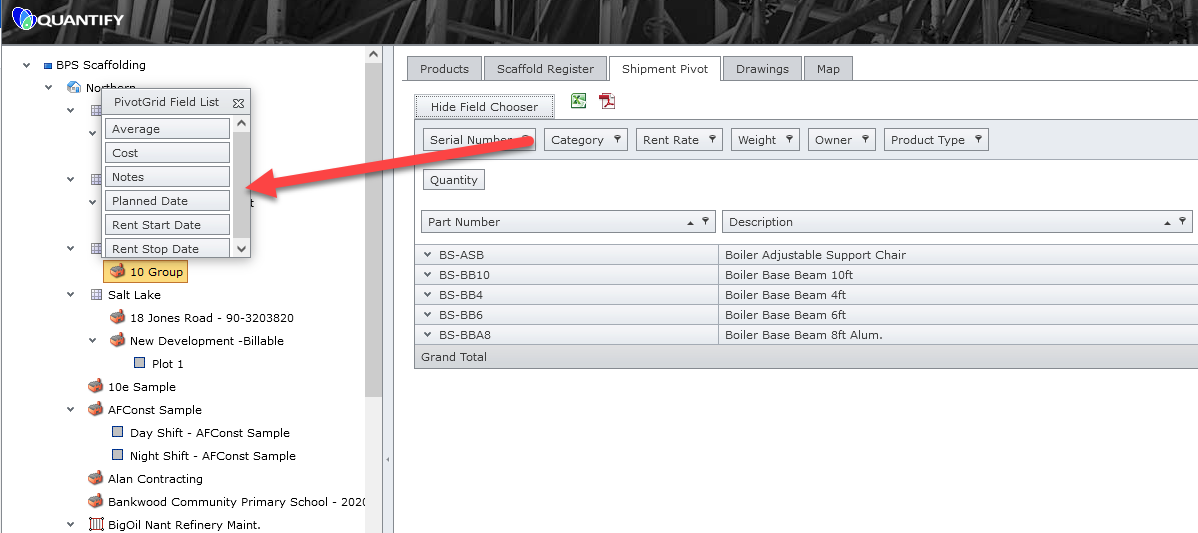
Repeat the process as necessary.
Saving the Report as an Excel or PDF File
Once you have configured the Scaffold Register pivot report, Quantify Web enables you to save it as an Excel or PDF file, with the click of a button.
To download the report as an Excel or PDF file, click either the Open as Excel (![]() ) or Save as PDF (
) or Save as PDF (![]() ) button.
) button.

Quantify downloads the file to your default downloads folder.