It is possible to group a column by dragging a column from the table to the group panel section. To do this, drag the selected column header and place it in between the toolbar and the table (see below). You will then be able to group by that column.
The Requests table will then be grouped by Activity
Note: You can group by more than one column. Simply, drag a column to the group panel section. In the example below, Activity Type and Assigned to columns are being grouped.
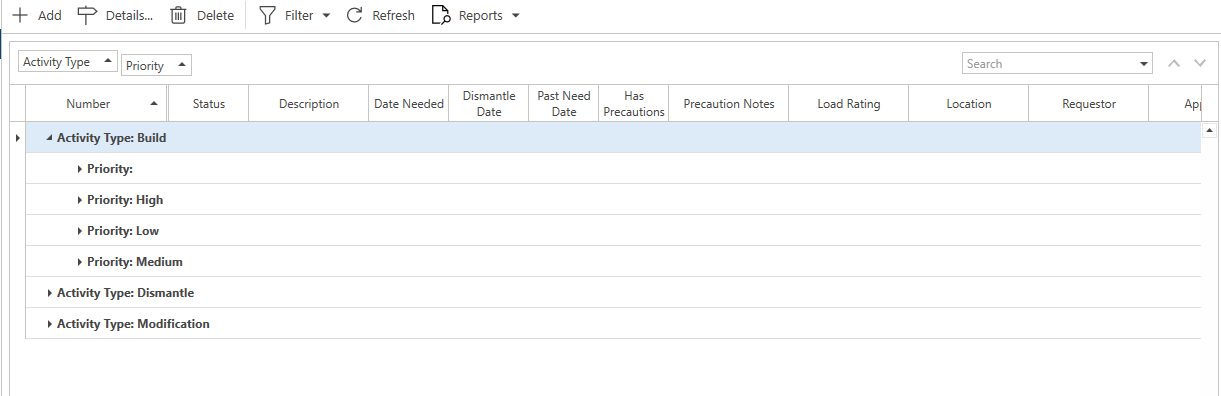
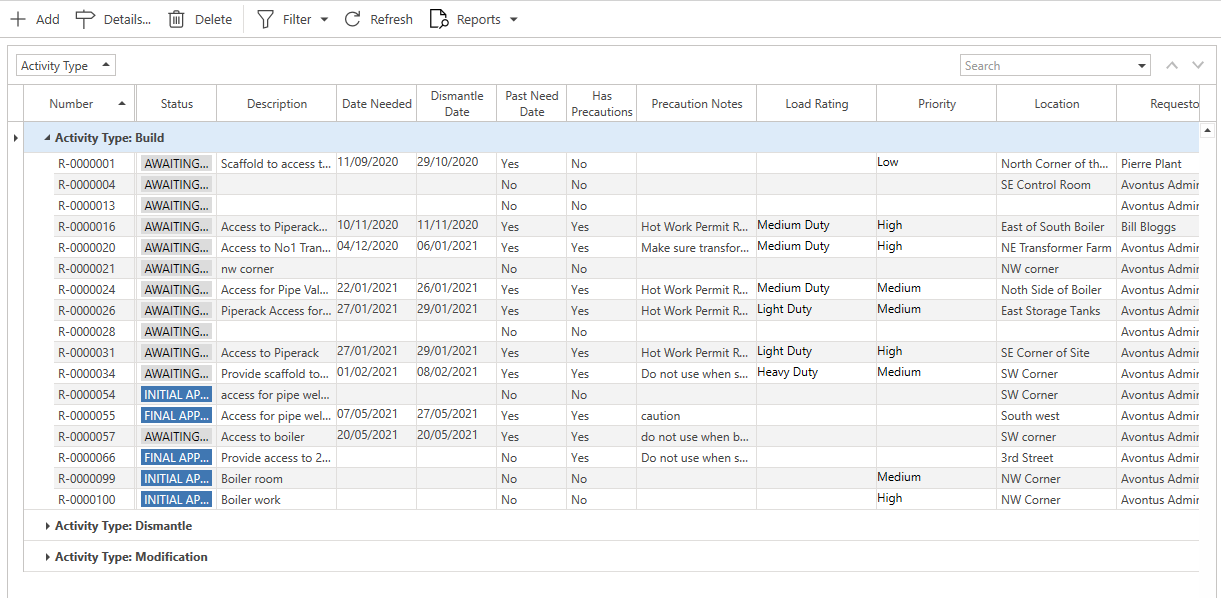
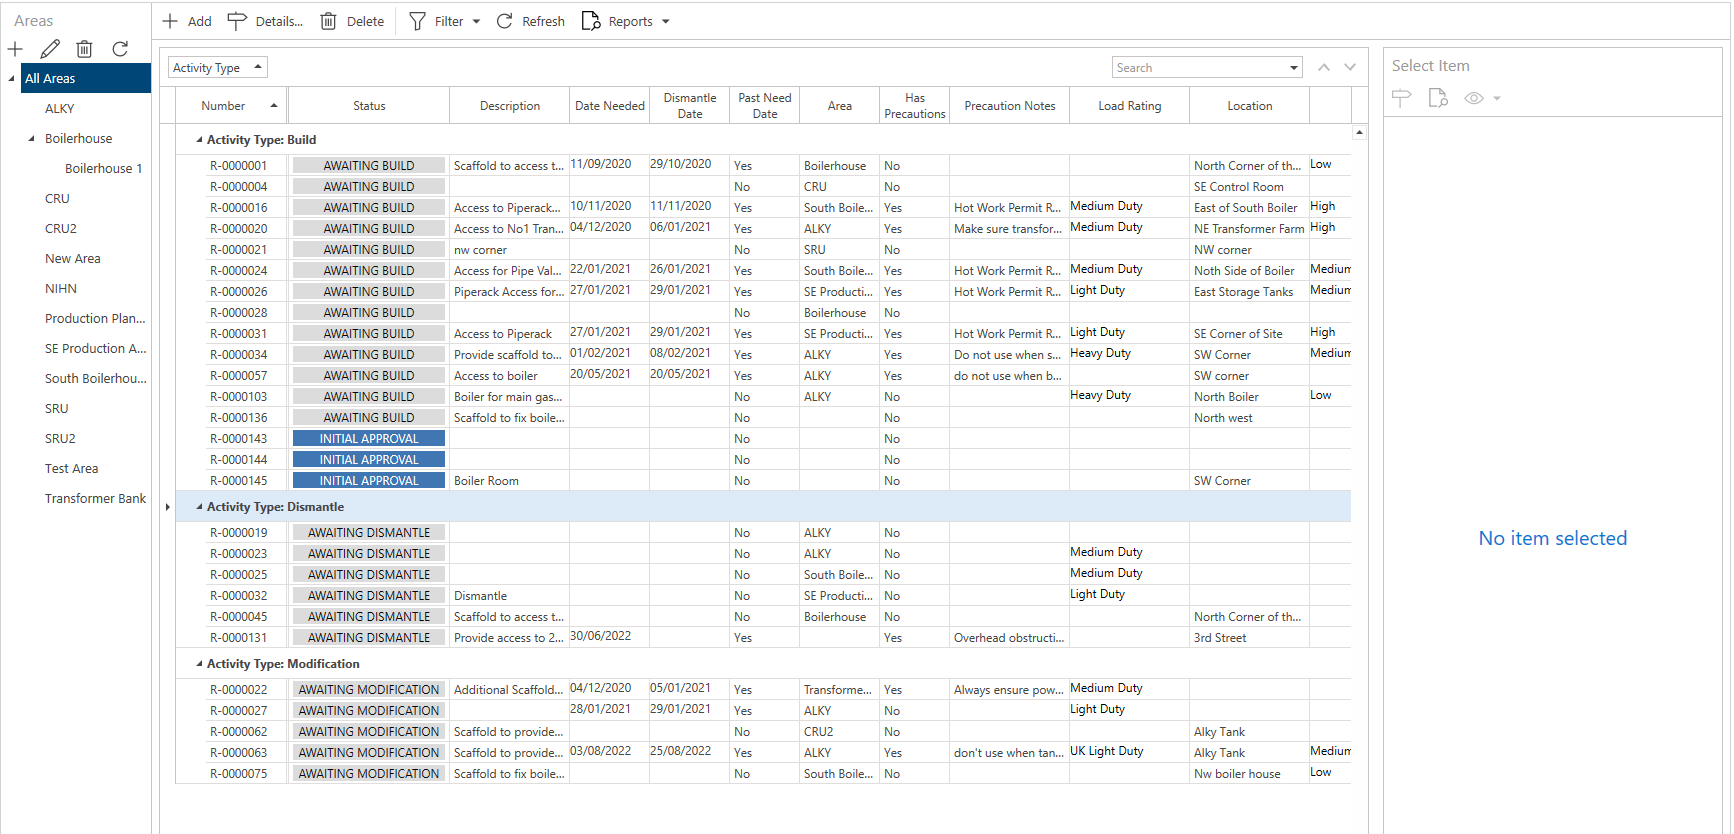
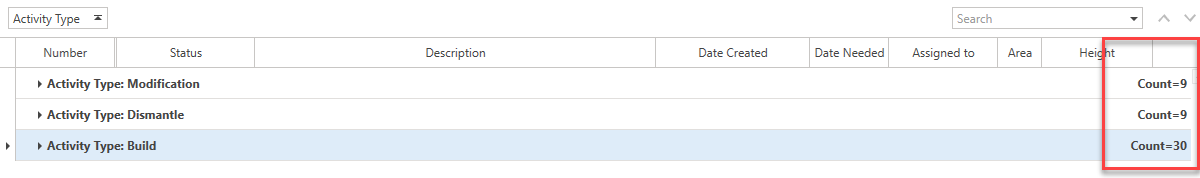
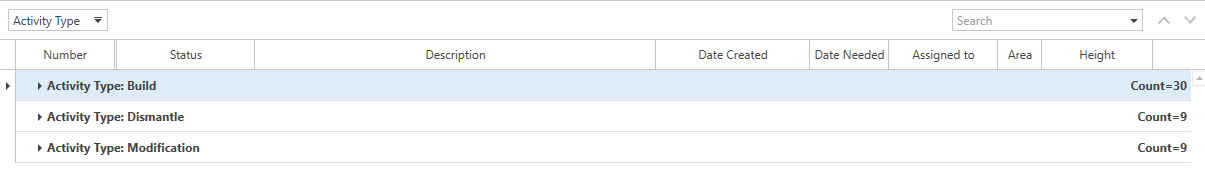
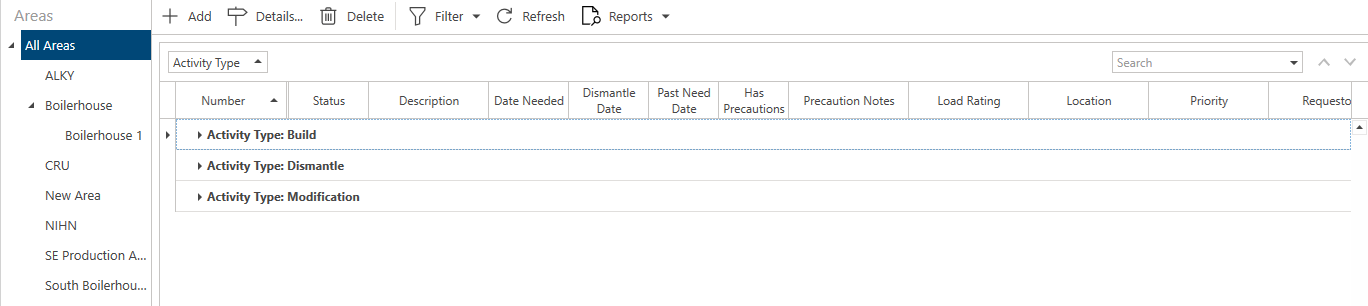
When you group by a column, each unique entry in the column will have its own group. For example, in the Activity Type column there are three unique entries (Build, Modification, Dismantle). Each of the entries will be given its own group, as shown below.
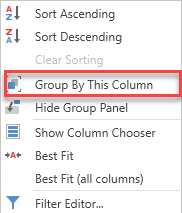
Note: Alternatively, to group a column you can right-click a column heading and select Group By This Column.
Click on a group to expand it.
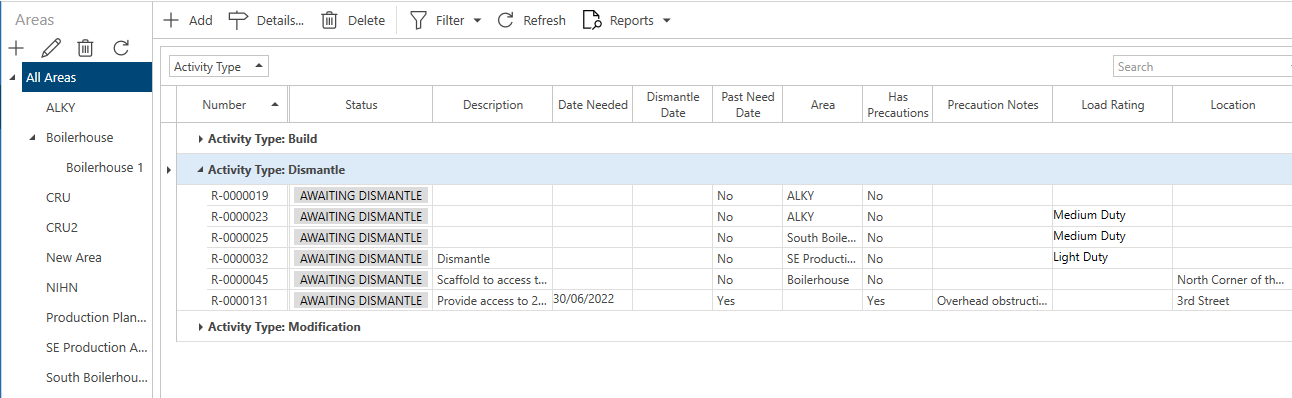
Expanding the Build Activity Type group will display all requests with the Activity Type set to Build.
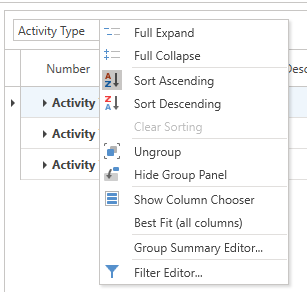
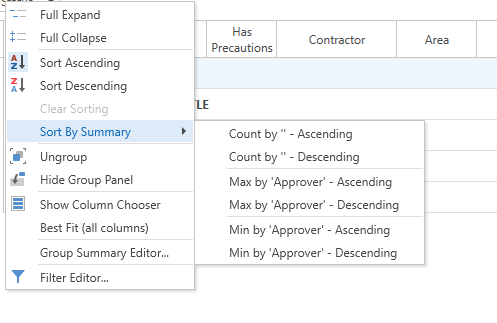
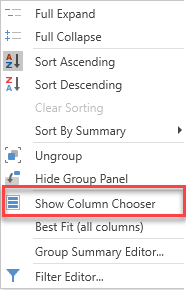
By right-clicking on the grouped column you can modify how the information is displayed in the table below.
Full Expand
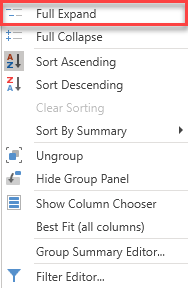
Expand all entries in the table to show further information for each group.
Full Collapse
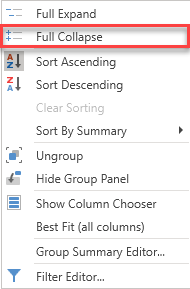
Collapse all groups in the table.
Sort Ascending
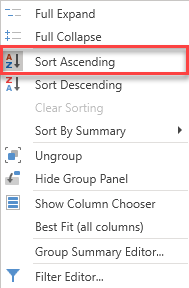
Sort the groups in ascending order either alphabetically or numerically.
Sort Descending
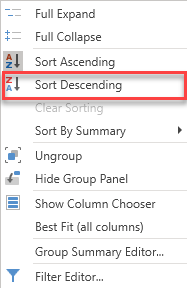
Sort the groups in descending order either alphabetically or numerically.
Clear Sorting
Clear any column sorting currently active.
Sort by Summary
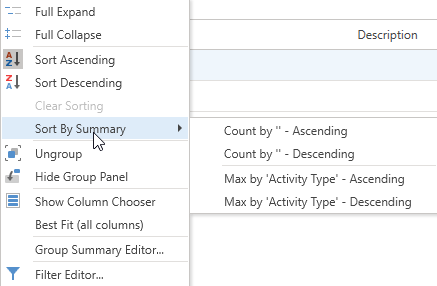
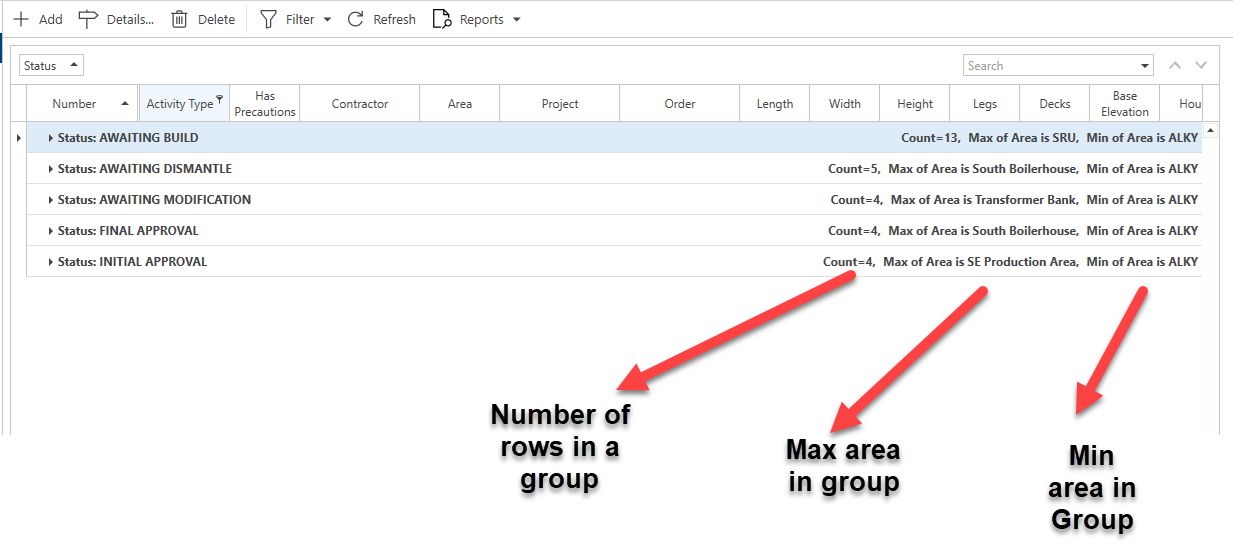
A summary is a brief overview of what content is held within that group. This summary contains information about that group such as the number of rows within that group and the maximum or minimum entry in a group from a selected column.
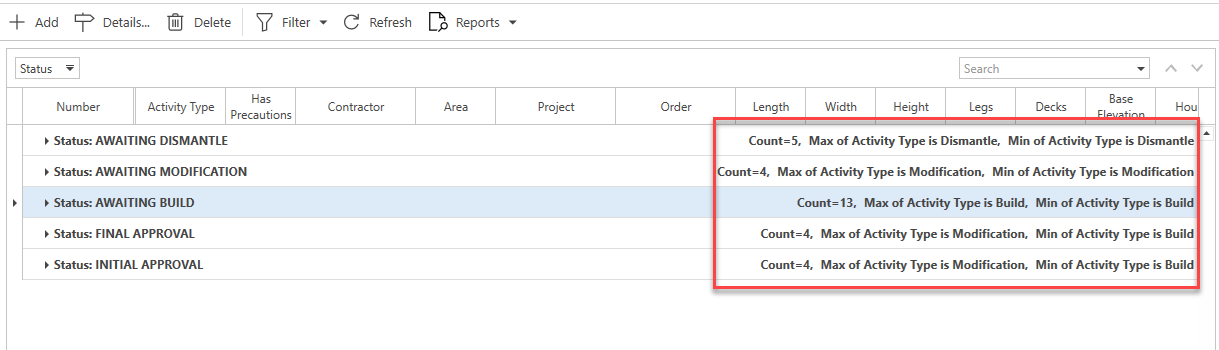
For example, when grouping by Status, you could select to display information from the Area column for each group. The summary would then provide an overview of the data pulled from the Area column including the number of entries in each group and the minimum and/or maximum status of each group.
Note: To Sort by Summary, enable the Group Summary Editor (see below).
Group Summary Editor
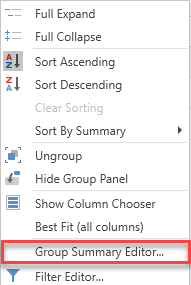
When grouping, this option allows the user to adjust what is displayed in the group summary, such as the maximum and minimum value within that group and the number of rows within the group.
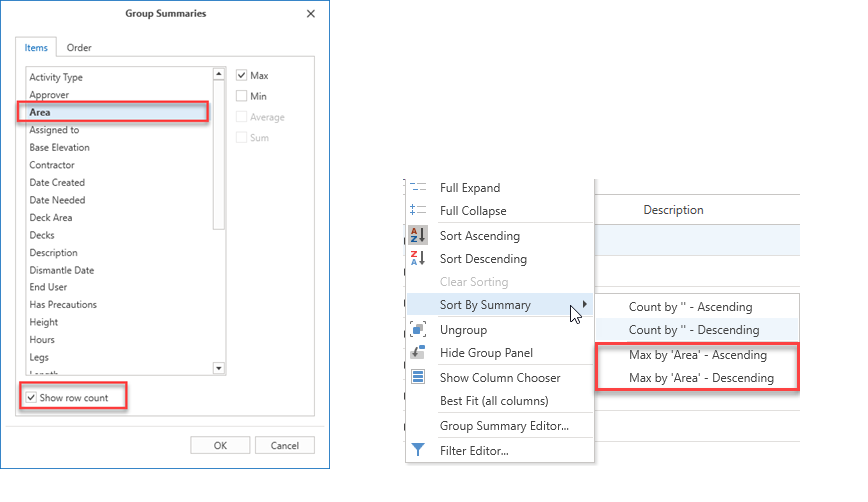
To the left-hand side are the columns and to the right are the summary options. Select a column on the left and this will be the column where the information is pulled from.
Selecting Max and Min will enable Max by – Ascending, Max by - Descending, Min By – Ascending, and Min by – Descending summary options for the chosen column.
In the example below, the maximum area of the group will be displayed for each group.
Click the Show row count to enable a count for the number of rows within the group.
Note: The Max by Area summary options will change depending upon the selected column. For example, selecting Approver in the Group Summary Editor will set the summary option to 'Max by Approver'.
Order
The Order tab of the Group Summary Editor allows the user to modify how the summary is presented.
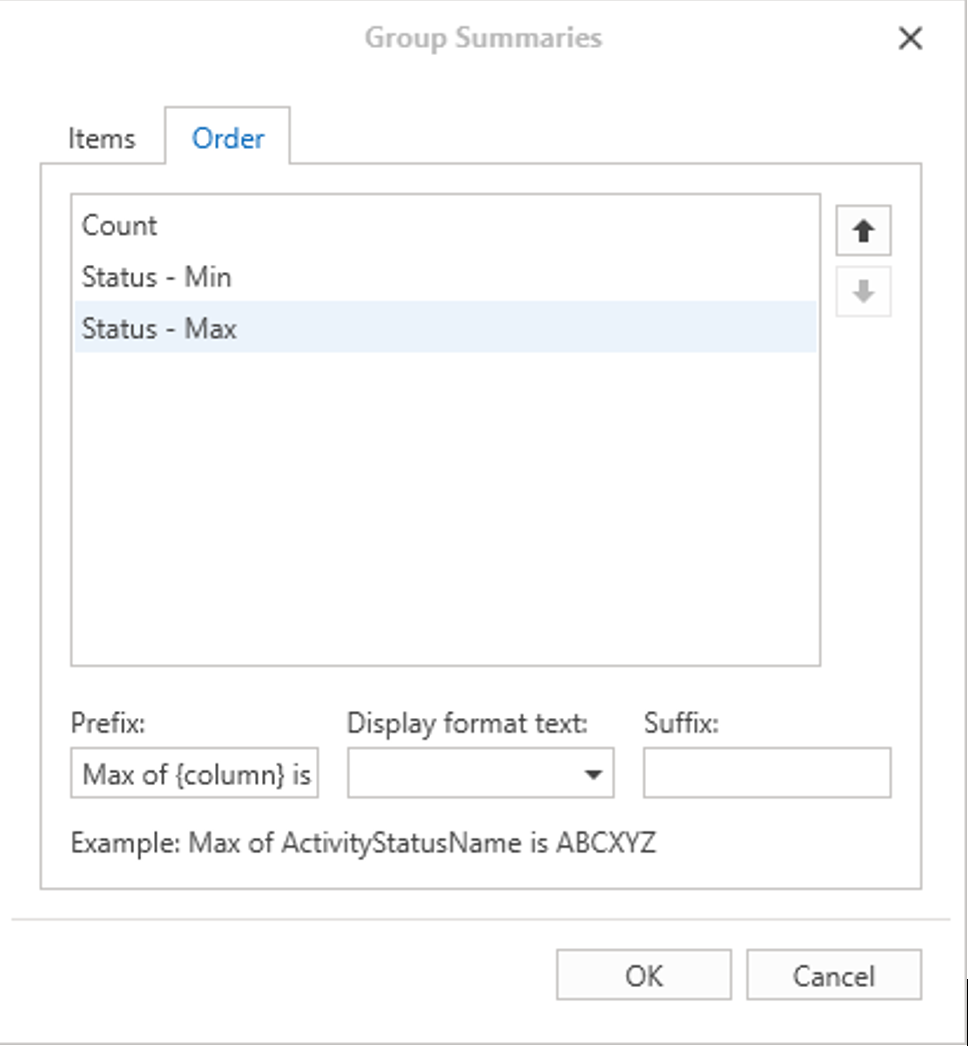
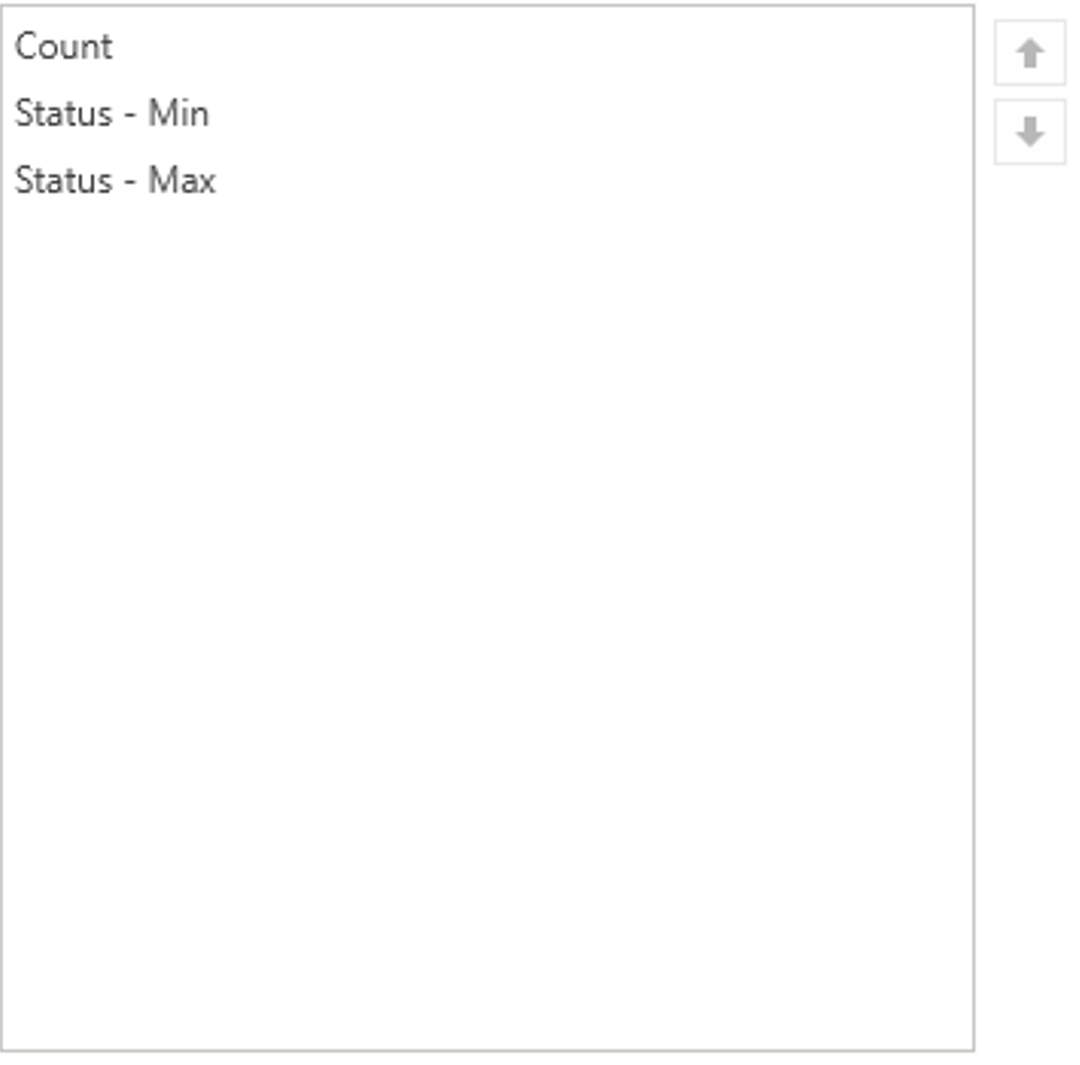
The box below lists the columns you selected in the Items tab. You can use the arrow buttons to the right to adjust in which order the summaries are displayed.
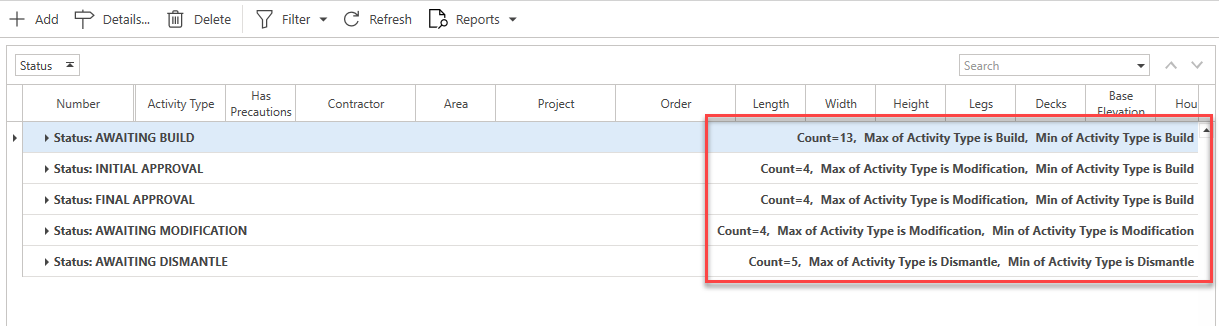
If you selected to display the summaries as defined in the image above, then the group summary will appear like so in the main table.

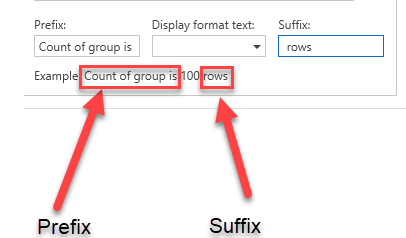
The Prefix, Display format text, and Suffix options allow the user to adjust the wording of the summary.
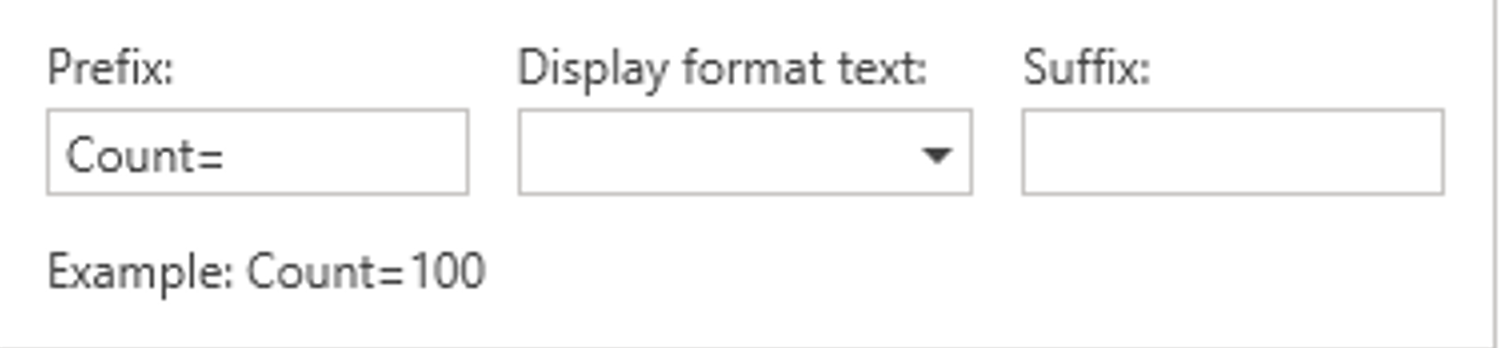
Prefix is the text before the maximum/minimum displayed content for the group.
Display format text is used with the group row count and this adjusts how the numbers are displayed.
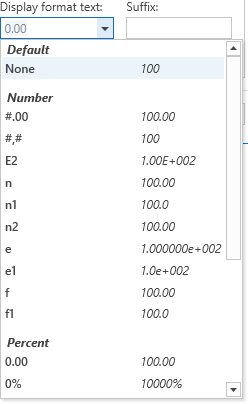
The Suffix is the text that goes after the maximum/minimum displayed content for the group.
Note: Remember to include a space after the Prefix and before the Suffix.
Note: 100 is an example and the actual number will be the number of rows in the group.
Count by Ascending
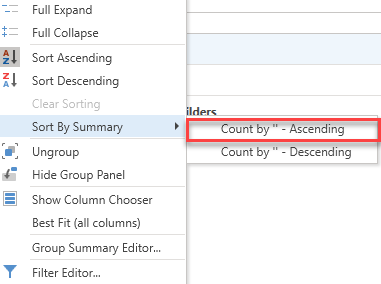
When grouping, count the number of entries in a group and sort by ascending order.
Count by Descending
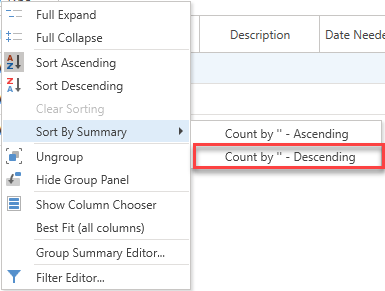
When grouping, count the number of entries in a group and sort by descending order.
Max/Min By Activity Type Ascending
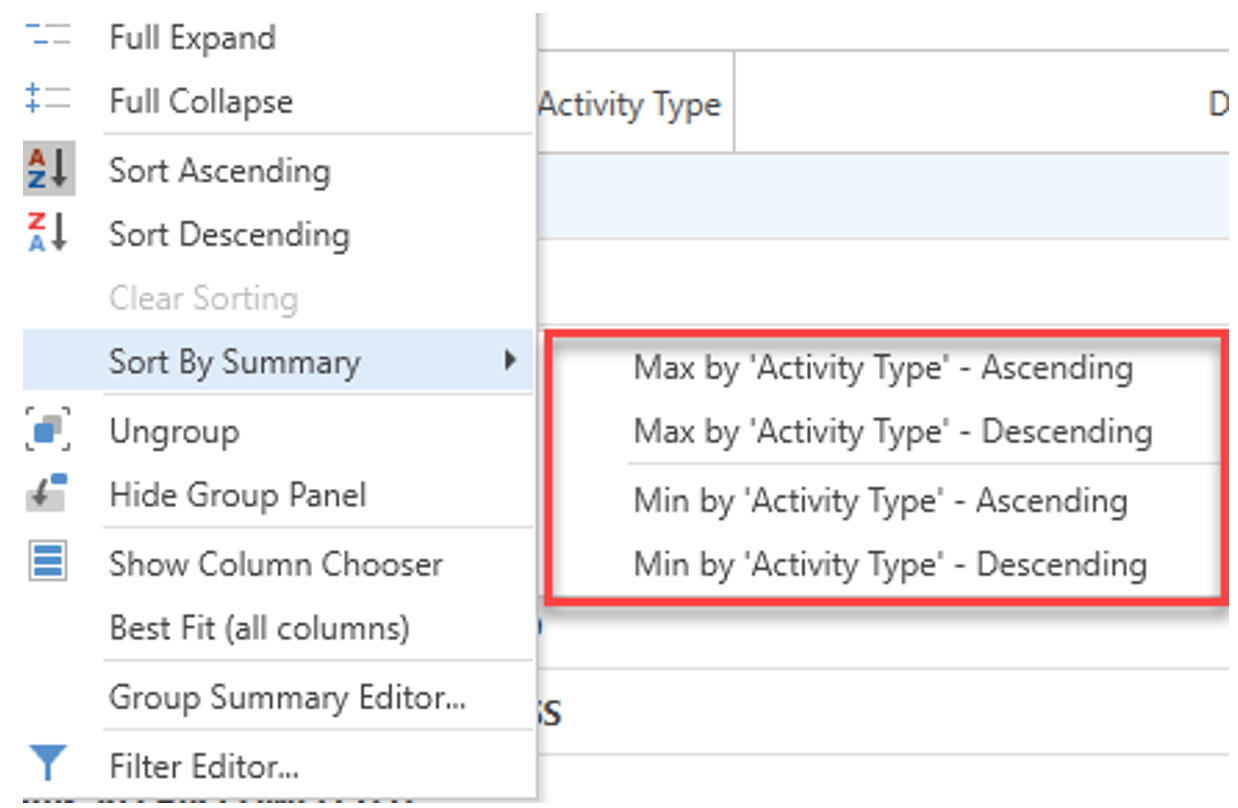
When grouping, count the maximum or the minimum number of activity types in each entry and sort by ascending order.
Max/Min By Activity Type Descending
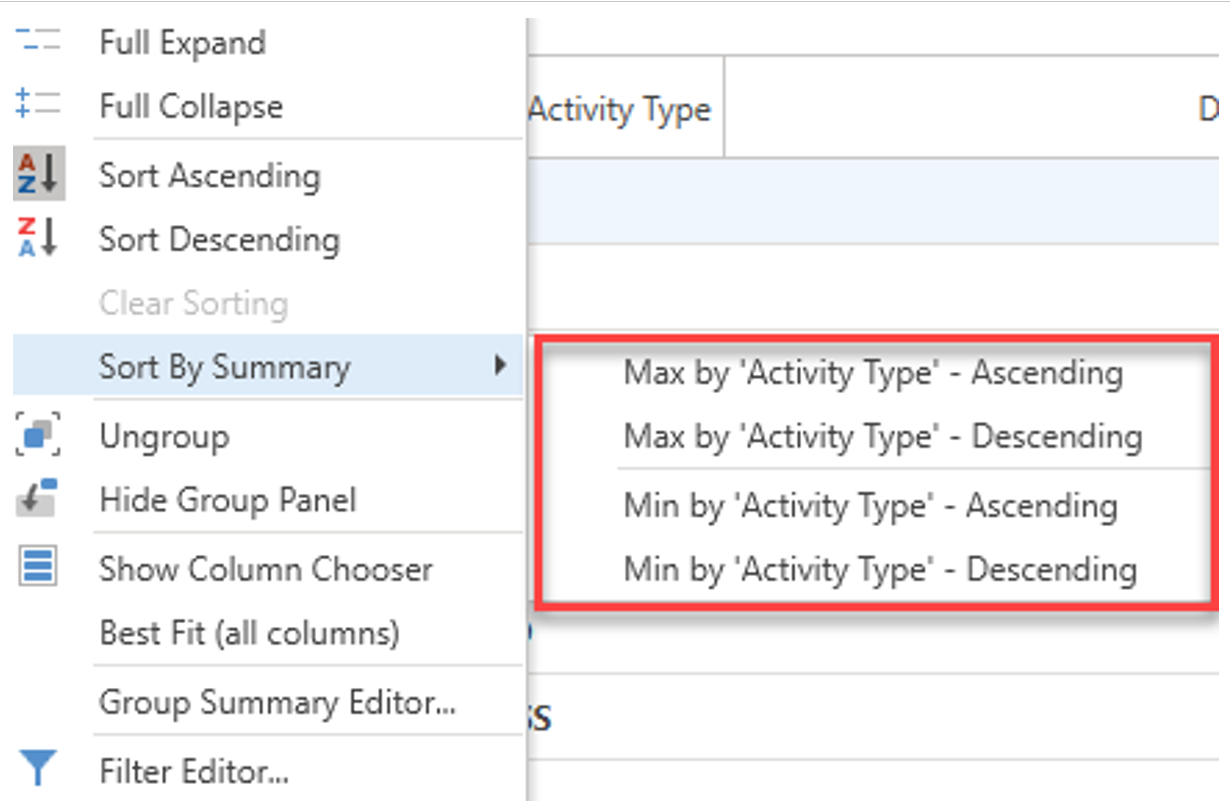
When grouping, count the maximum or the minimum number of activity types in each entry and sort by descending order.
Ungroup
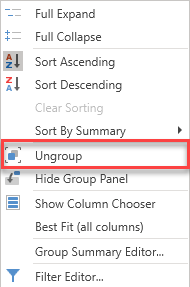
Move the grouped column back to the table. This means you will be unable to group by a column.
This is what the Request screen looks like when ungrouped.
This is what the Request screen looks like when ungrouped.
Hide Group Panel
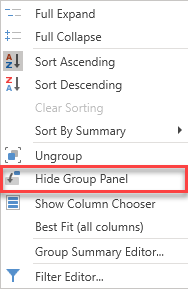
Hide the group panel.
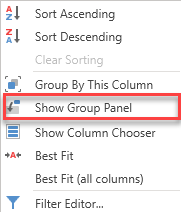
Note: When hiding the Group Panel you will be unable to group by column. You can select to show the Group Panel by right-clicking on a column name and selecting Show Group Panel.
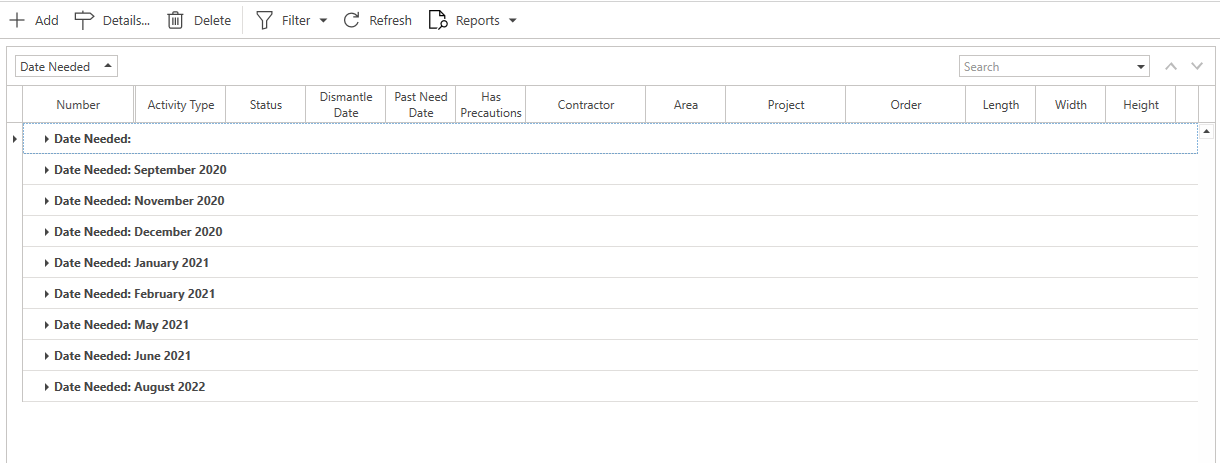
Group Interval
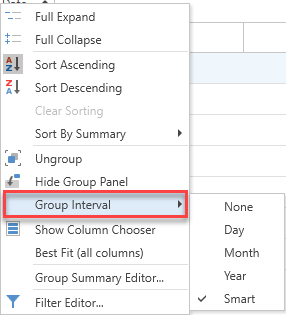
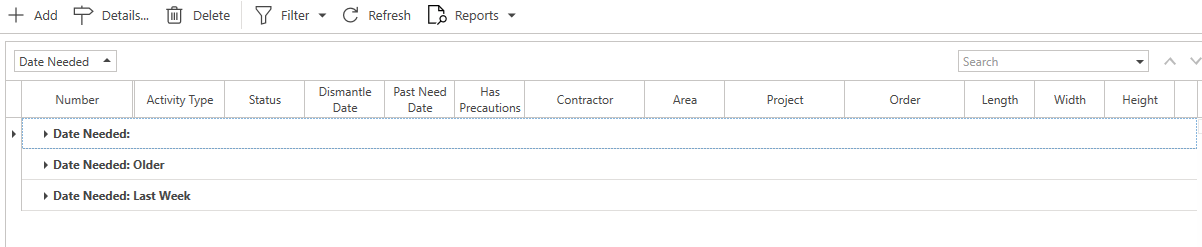
This is for date columns only and allows a user to group by daily, monthly, or yearly intervals. The below example is grouped on a monthly basis.
Smart Interval groups the dates into a different format where the groups are split over a time period of a month and over and a week ahead.
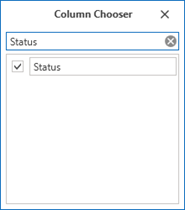
Show Column Chooser
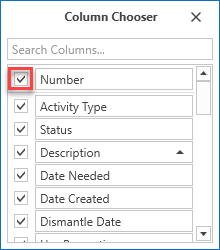
The Column Chooser allows the user to specify which columns to display in the table. This allows you to reduce (or increase) the amount of data displayed in the table so that you can, at a glance, see more relevant information that is of greater use to you.
To enable/disable the column, select the checkbox of the relevant column.
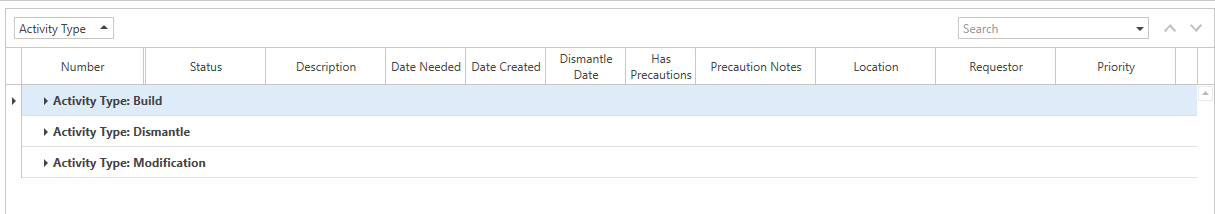
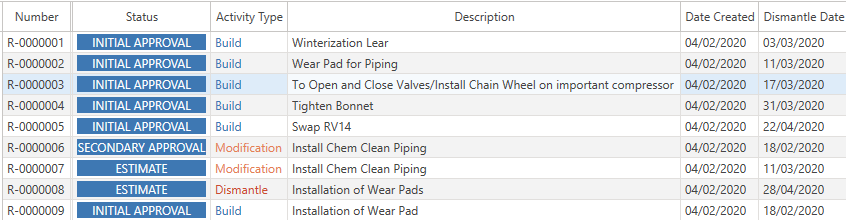
For example, you can specify to show only Number, Status, Description, Date Created, Dismantle Date.
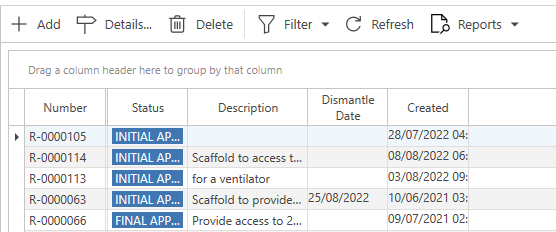
Selecting to display these columns will mean only these columns will be displayed in the table.
Note: You can use the Search Column textbox to search for a specific column to find a specific column quickly.
Best Fit
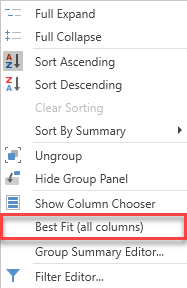
Size all columns to best fit the content within these columns. This will widen columns with a lot of content, such as the Description column.
Filter Editor
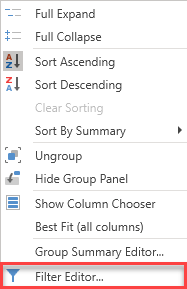
The Filter Editor allows the user to filter the table to display specific data.
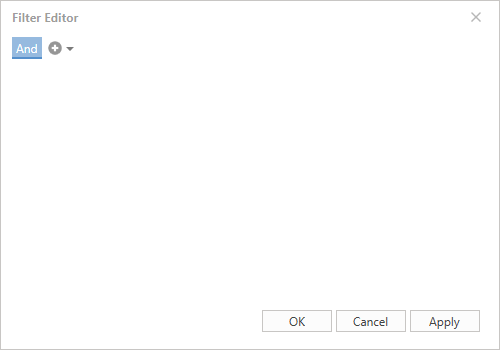
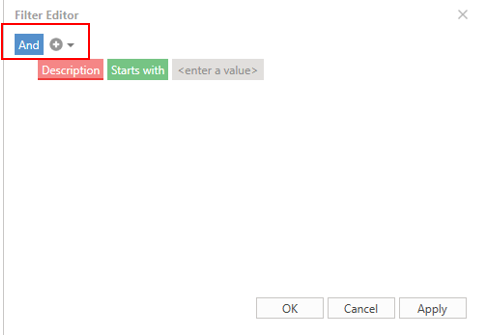
The Filter Editor uses conditional formulas to select the display data. The conditions for formulas are selected by clicking the And button and then the +.
For more information, please visit the /wiki/spaces/ADH/pages/2323137013 guide.