The Web Dashboard provides an overview of your Requests and Scaffolds, such as their status. You can see how many Requests you have open (requests that have not been completed), and how many standing Scaffolds you have.
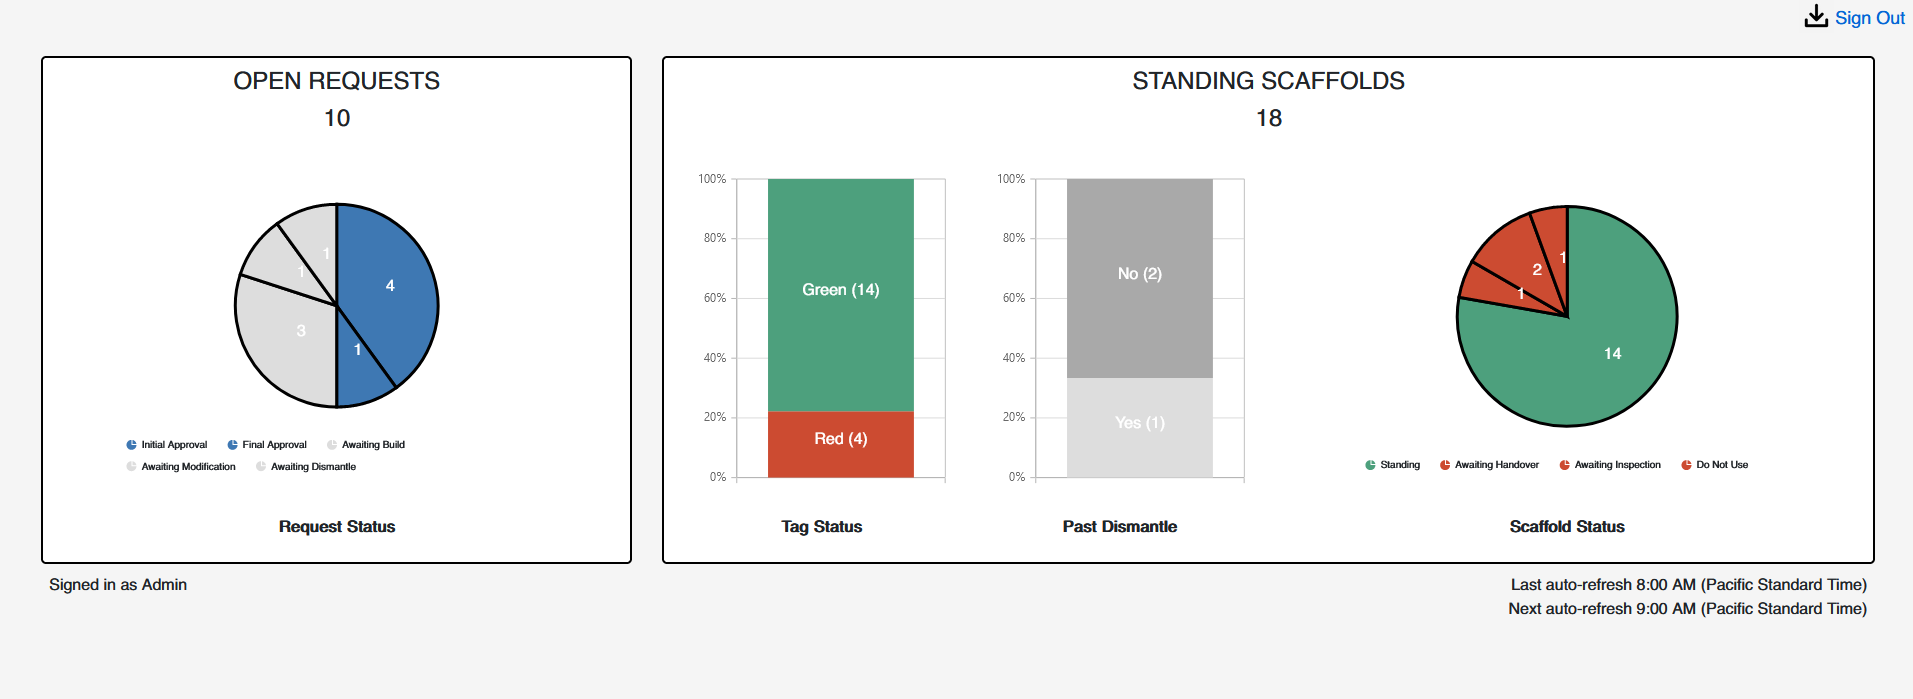
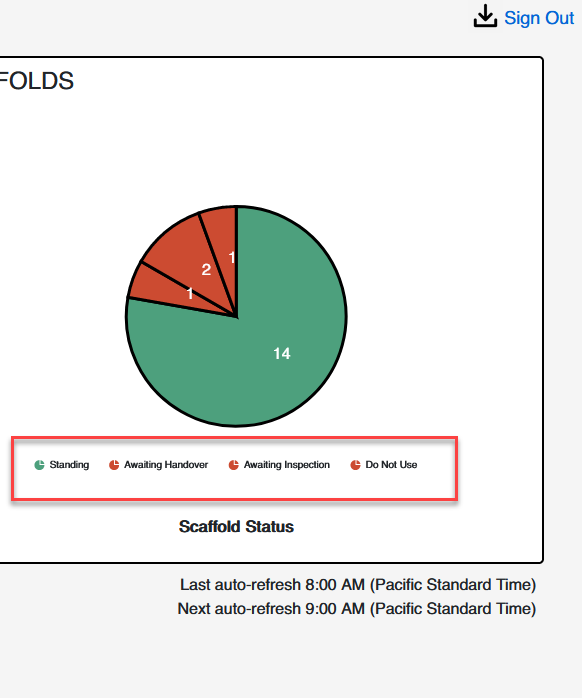
The data is displayed in pie charts. Under each pie chart is a Legend which will help you decipher the information contained within the chart. For example, the legend for the Standing Scaffolds Pie charts shows that there are scaffolds in the Standing, Awaiting Handover, Awaiting inspection and Do Not Use.
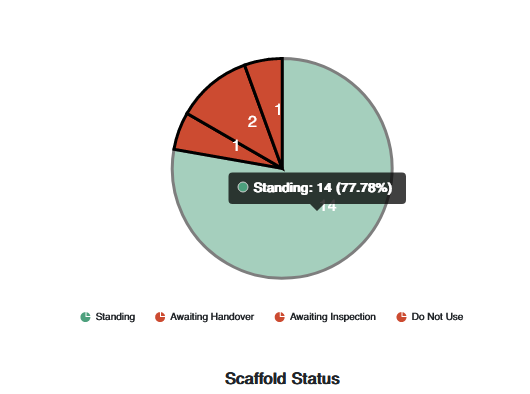
If you hover over a Pie segment, you can see more information on that segment.