In order to further illustrate how you can customize the pivot grid to produce the data you need, the procedures below show you how to use the Product Pricing pivot to create a report that shows:
- Total Calculated Average Cost along with Quantity Available (if the location is a Branch Office)
- Quantity at Job Site (if the location is a Job Site) for products at a Branch Office
To create a Total Calculated Average Cost report:
- Locate and click the appropriate Branch Office in the Organization Tree.
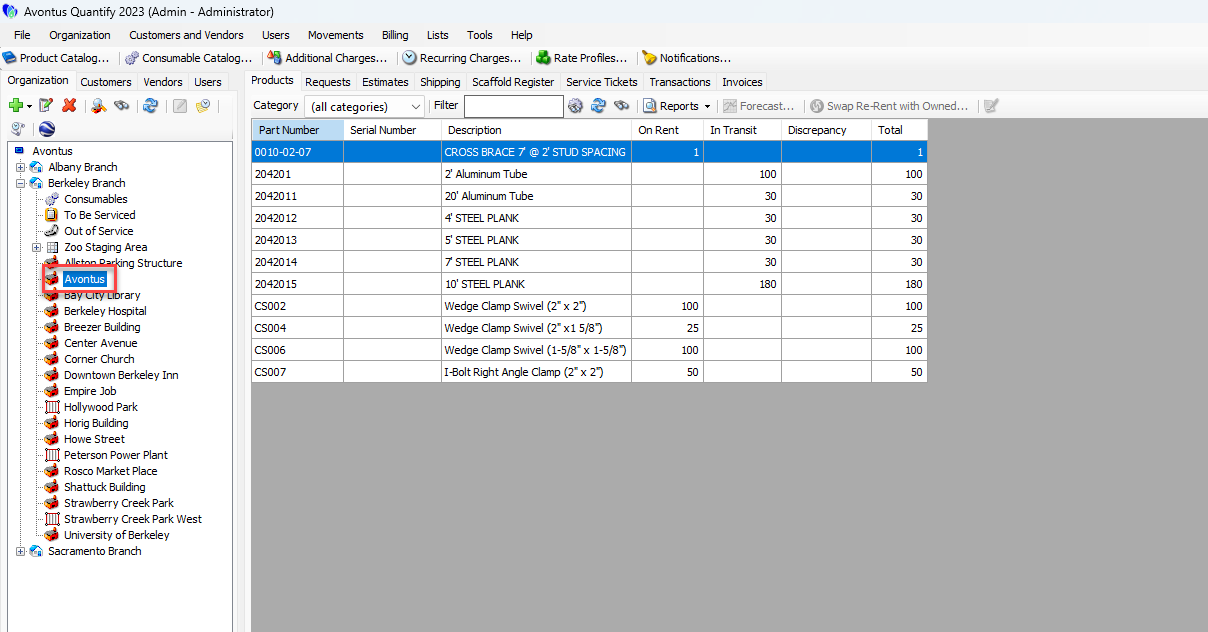
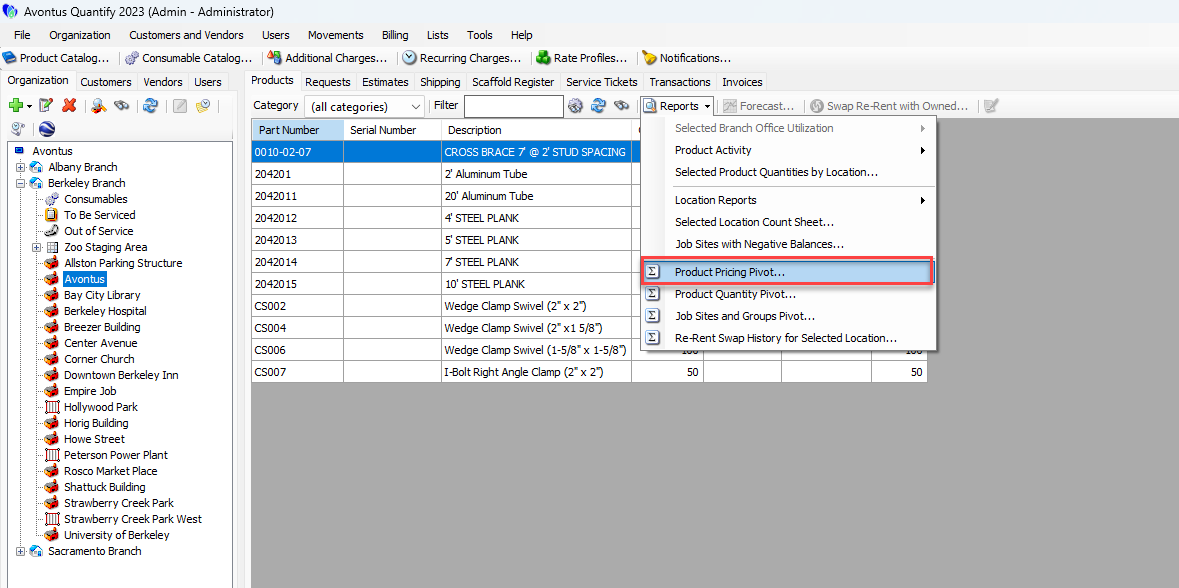
- Click the Products tab, then click the Reports dropdown and select Product Pricing Pivot.
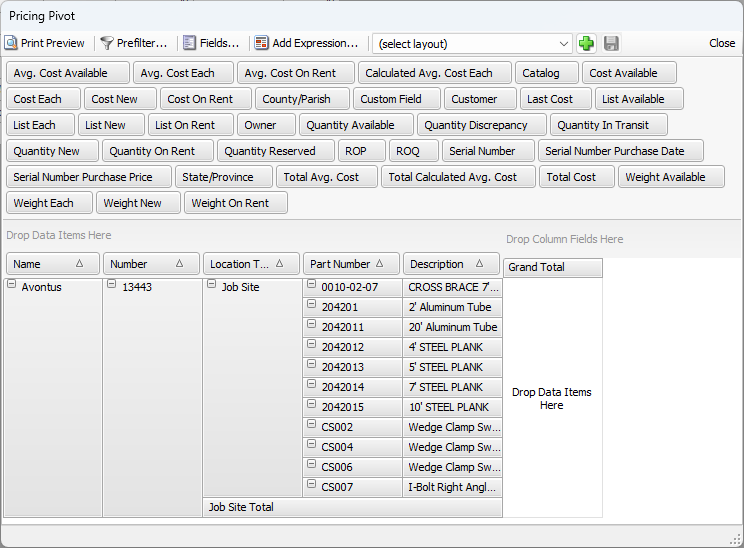
 The Pricing Pivot dialog appears, displaying the default layout.
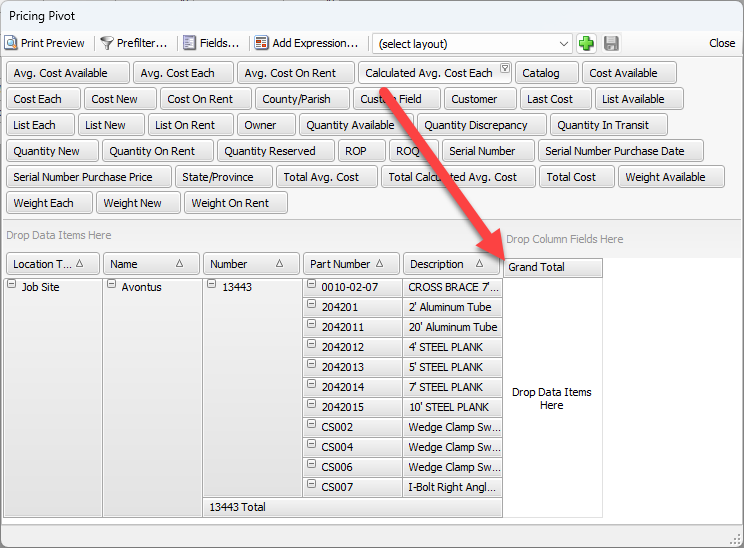
- Click the Location Type field and drag it to the left of the Name field.
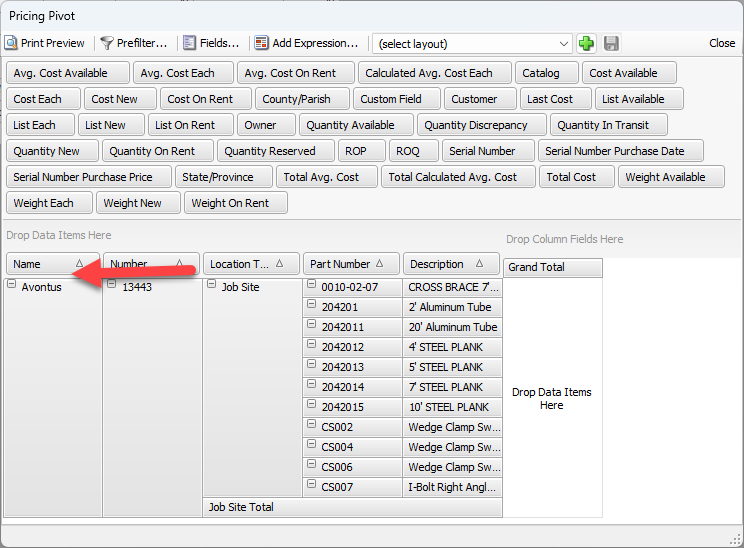 The result should look like this:
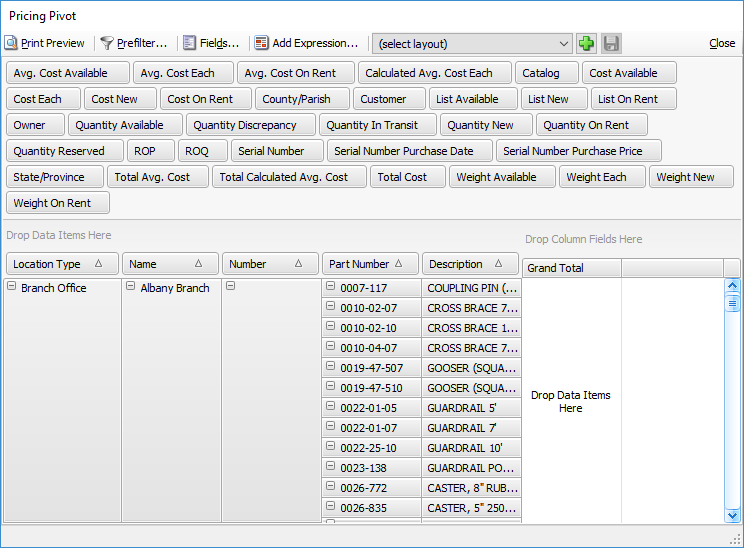
- Click the Calculated Avg. Cost Each field and drag it to the right of the Description field.
 The result should look like this:
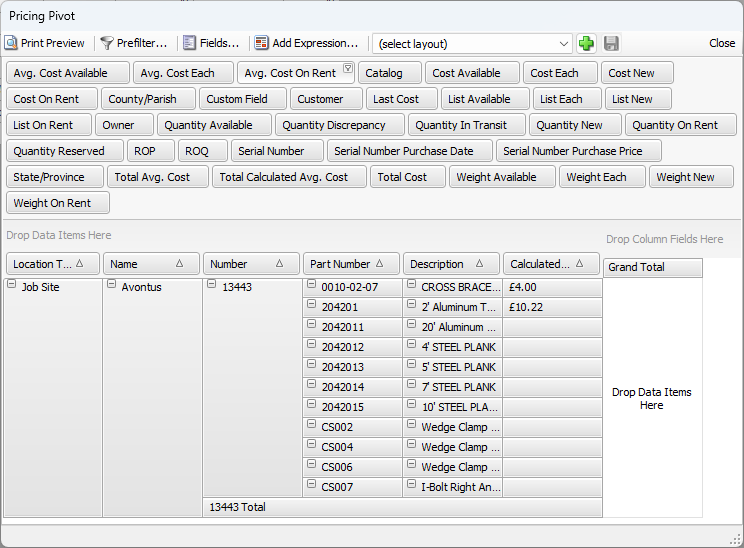
- Click the Quantity Available and Quantity on Rent fields and drag them to the Grand Total section.
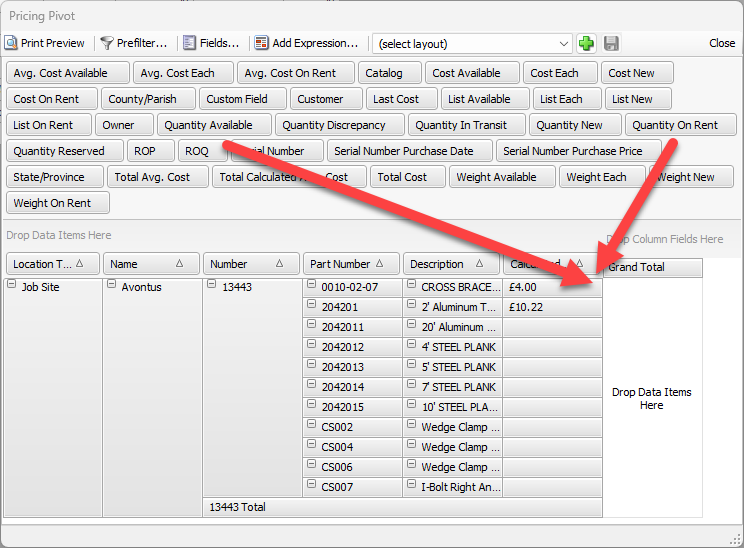
- Click the Quantity on Rent field and drag it to the right of the Quantity Available field.
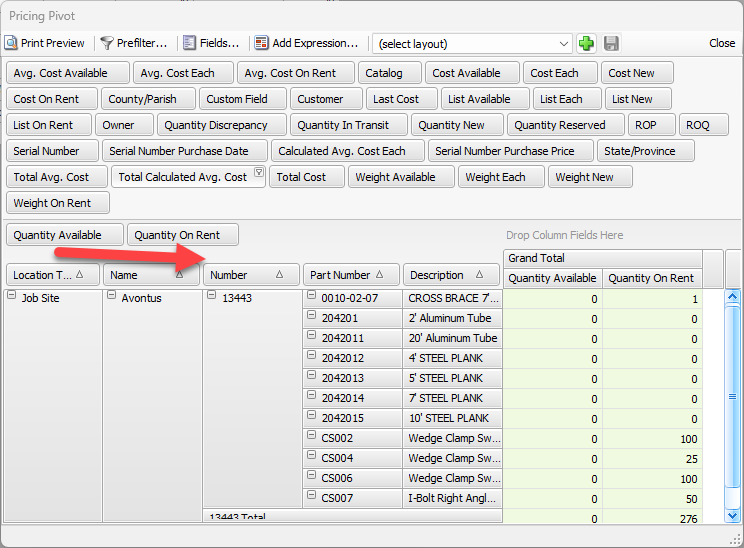 This rearranges their order in the Grand Total area of the dialog..
The pivot grid should now look like this.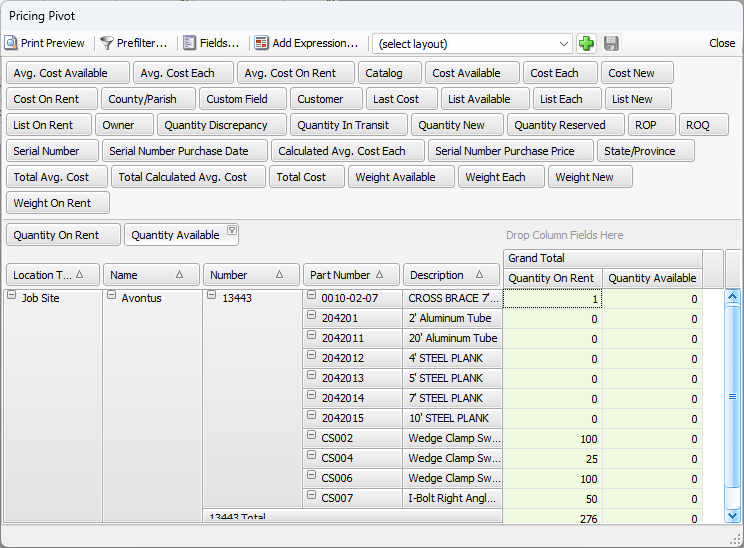
You can now save your customized layout for future retrieval. Refer to the Saving a Customized Pivot Report section of Editing, Saving and Viewing Pivot Reports.