Customizing (editing) pivot report layouts includes: reordering fields (seeCreate a Total Calculated Average Cost Report for examples), filtering, adding fields and/or adding an expression.
You can save, restore and further edit edited pivot report layouts.
Customizing a Pivot Report
You can customize pivot reports to show the data you need the way you need it and save the layouts for future use.
The procedures below show you how to filter, remove and reorder columns, and provide a total for your desired data. Specifically you will customize the Scaffold Tag Pivot report to show Purchase Order, Work Order, Parent Job Site, Tag, Actual Build (in that order) and Piece count for on-rent items only.
Note: To see an example of pivot report customization, refer to Example: Creating a Total Calculated Average Cost Report.
To customize a pivot report:
Click the appropriate Branch Office or Job Site.
Click the Scaffold Register tab.
Click the Reports dropdown and select Scaffold Pivot.
.gif)
The Scaffold Pivot appears.

Click the Status field and drag it up to the list of available fields, to remove it from the body of the report.
Click the Filter button (upper right corner of status field)
Click On Rent (to put a check in it), then click Close.
The body of the pivot adjusts and Quantify removes the tags in statuses other than On Rent.

Click the PO field and drag it to the left of the Tag field.
Click the Work Order field and drag it to the left of the Tag field.
Click the Parent Job Site field and drag it to the left of the Tag field.
Click any fields you don’t need and drag them up to the list of available fields to remove them from the body of the report:
Parent Job Number
Planned Build
Planned Dismantle
Actual Dismantle
Click the Pieces field and drag it to the Grand Total section.
Note: You can click and drag multiple fields to this location in order to provide totals for multiple items. Refer to Create a Total Calculated Average Cost Reportfor an example.
The end result looks like this:

The report when print previewed looks like this:

Saving a Customized Pivot Report Layout
Quantify enables you to save your customized pivot report layout for future use.
To save a customized pivot report layout:
Access the appropriate pivot report.
Customize the layout as desired. (Refer to Customizing a Pivot Report above.)
Click the Save Pivot Layout button at the top of the pivot grid window.
The Layout Name dialog appears.In the Name text field and enter a name for the layout .
Click OK.
Quantify saves the layout to a named pivot layout. If you change the layout and want to save it under the same name you assigned above, click the Save Changes to the Layout button before exiting. Alternatively, you can save the modified layout under a different name.

Adding a Field to a Pivot Report
You can add additional fields to a pivot grid. The available fields will vary by pivot report.
Note: For a description of the pivot grid areas and field types, refer to the Pivot Grid Areas and Fields section of About Pivot Reports.
To add a field to a pivot report:
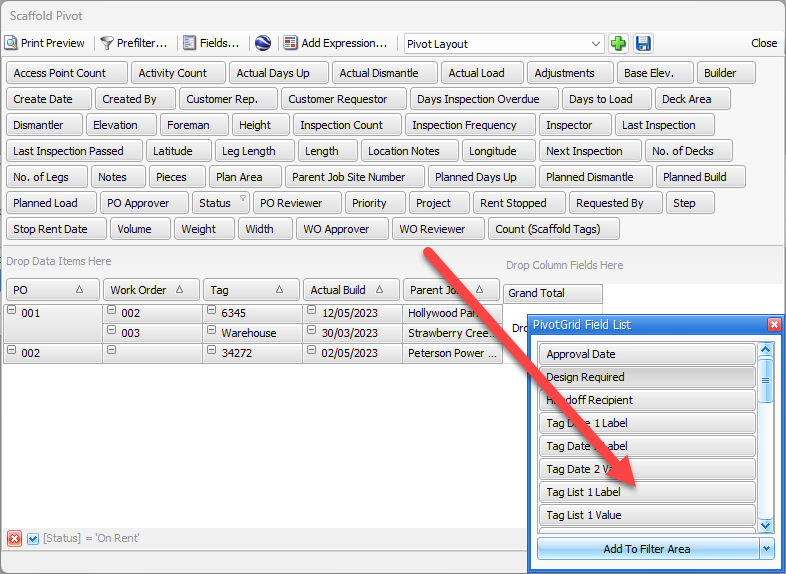
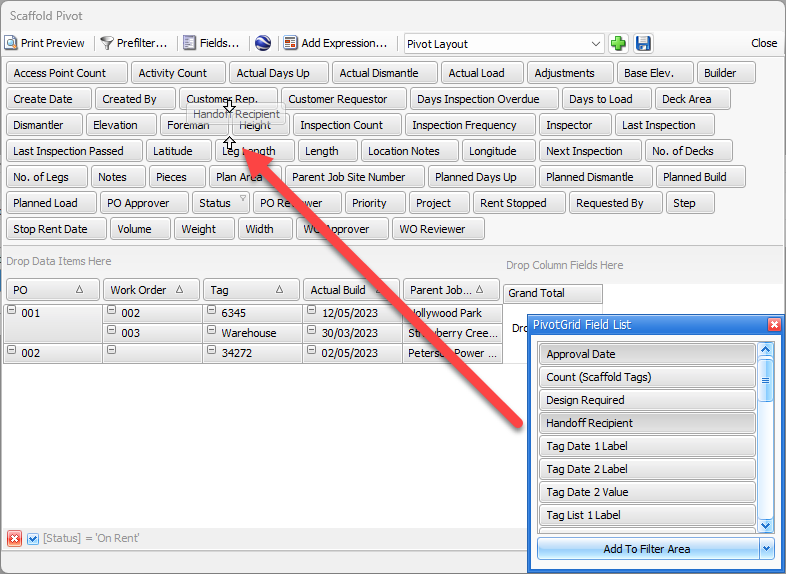
Click Fields, in the top of the pivot report dialog.
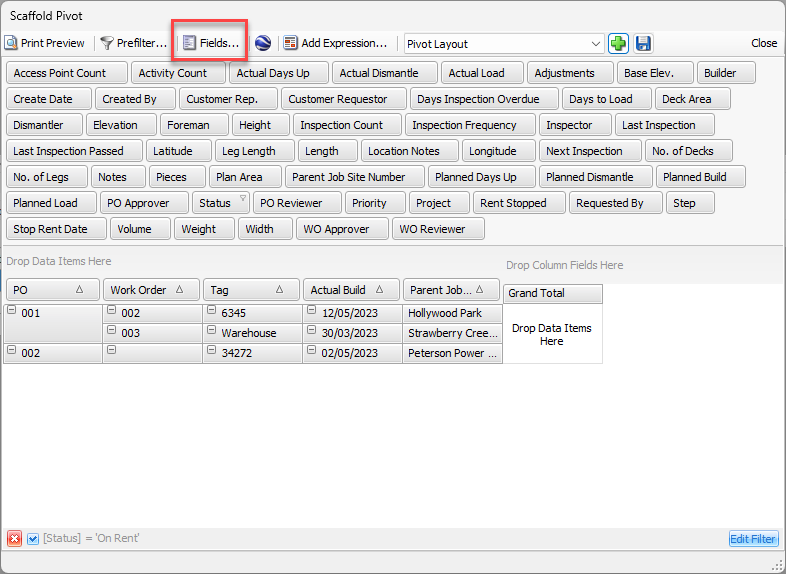
The PivotGrid Field List appears.
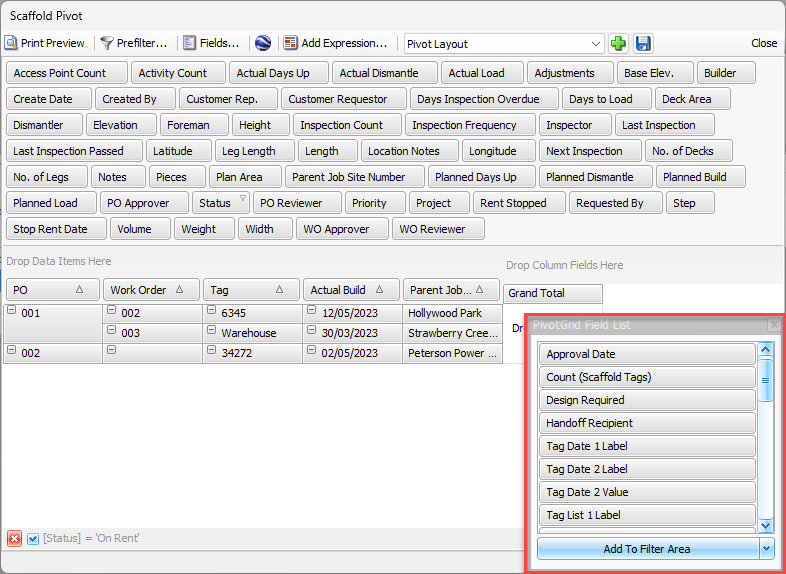
Add a field in one of the following ways.
Click and DragClick the appropriate field and drag it to the pivot grid area of your choice.
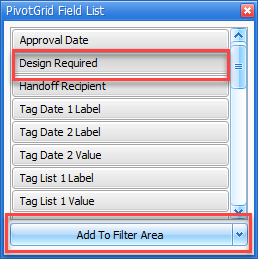
Button Configuration
Click the field you want to add
Click the Add To dropdown and select the appropriate area on the dialog to add the new field.
Note: Available areas will vary depending on the field you want to add.
Click Add to Filter Area
If you change your mind and want to remove a field you added to the pivot grid, click the field and drag it back to the PivotGrid Field List.