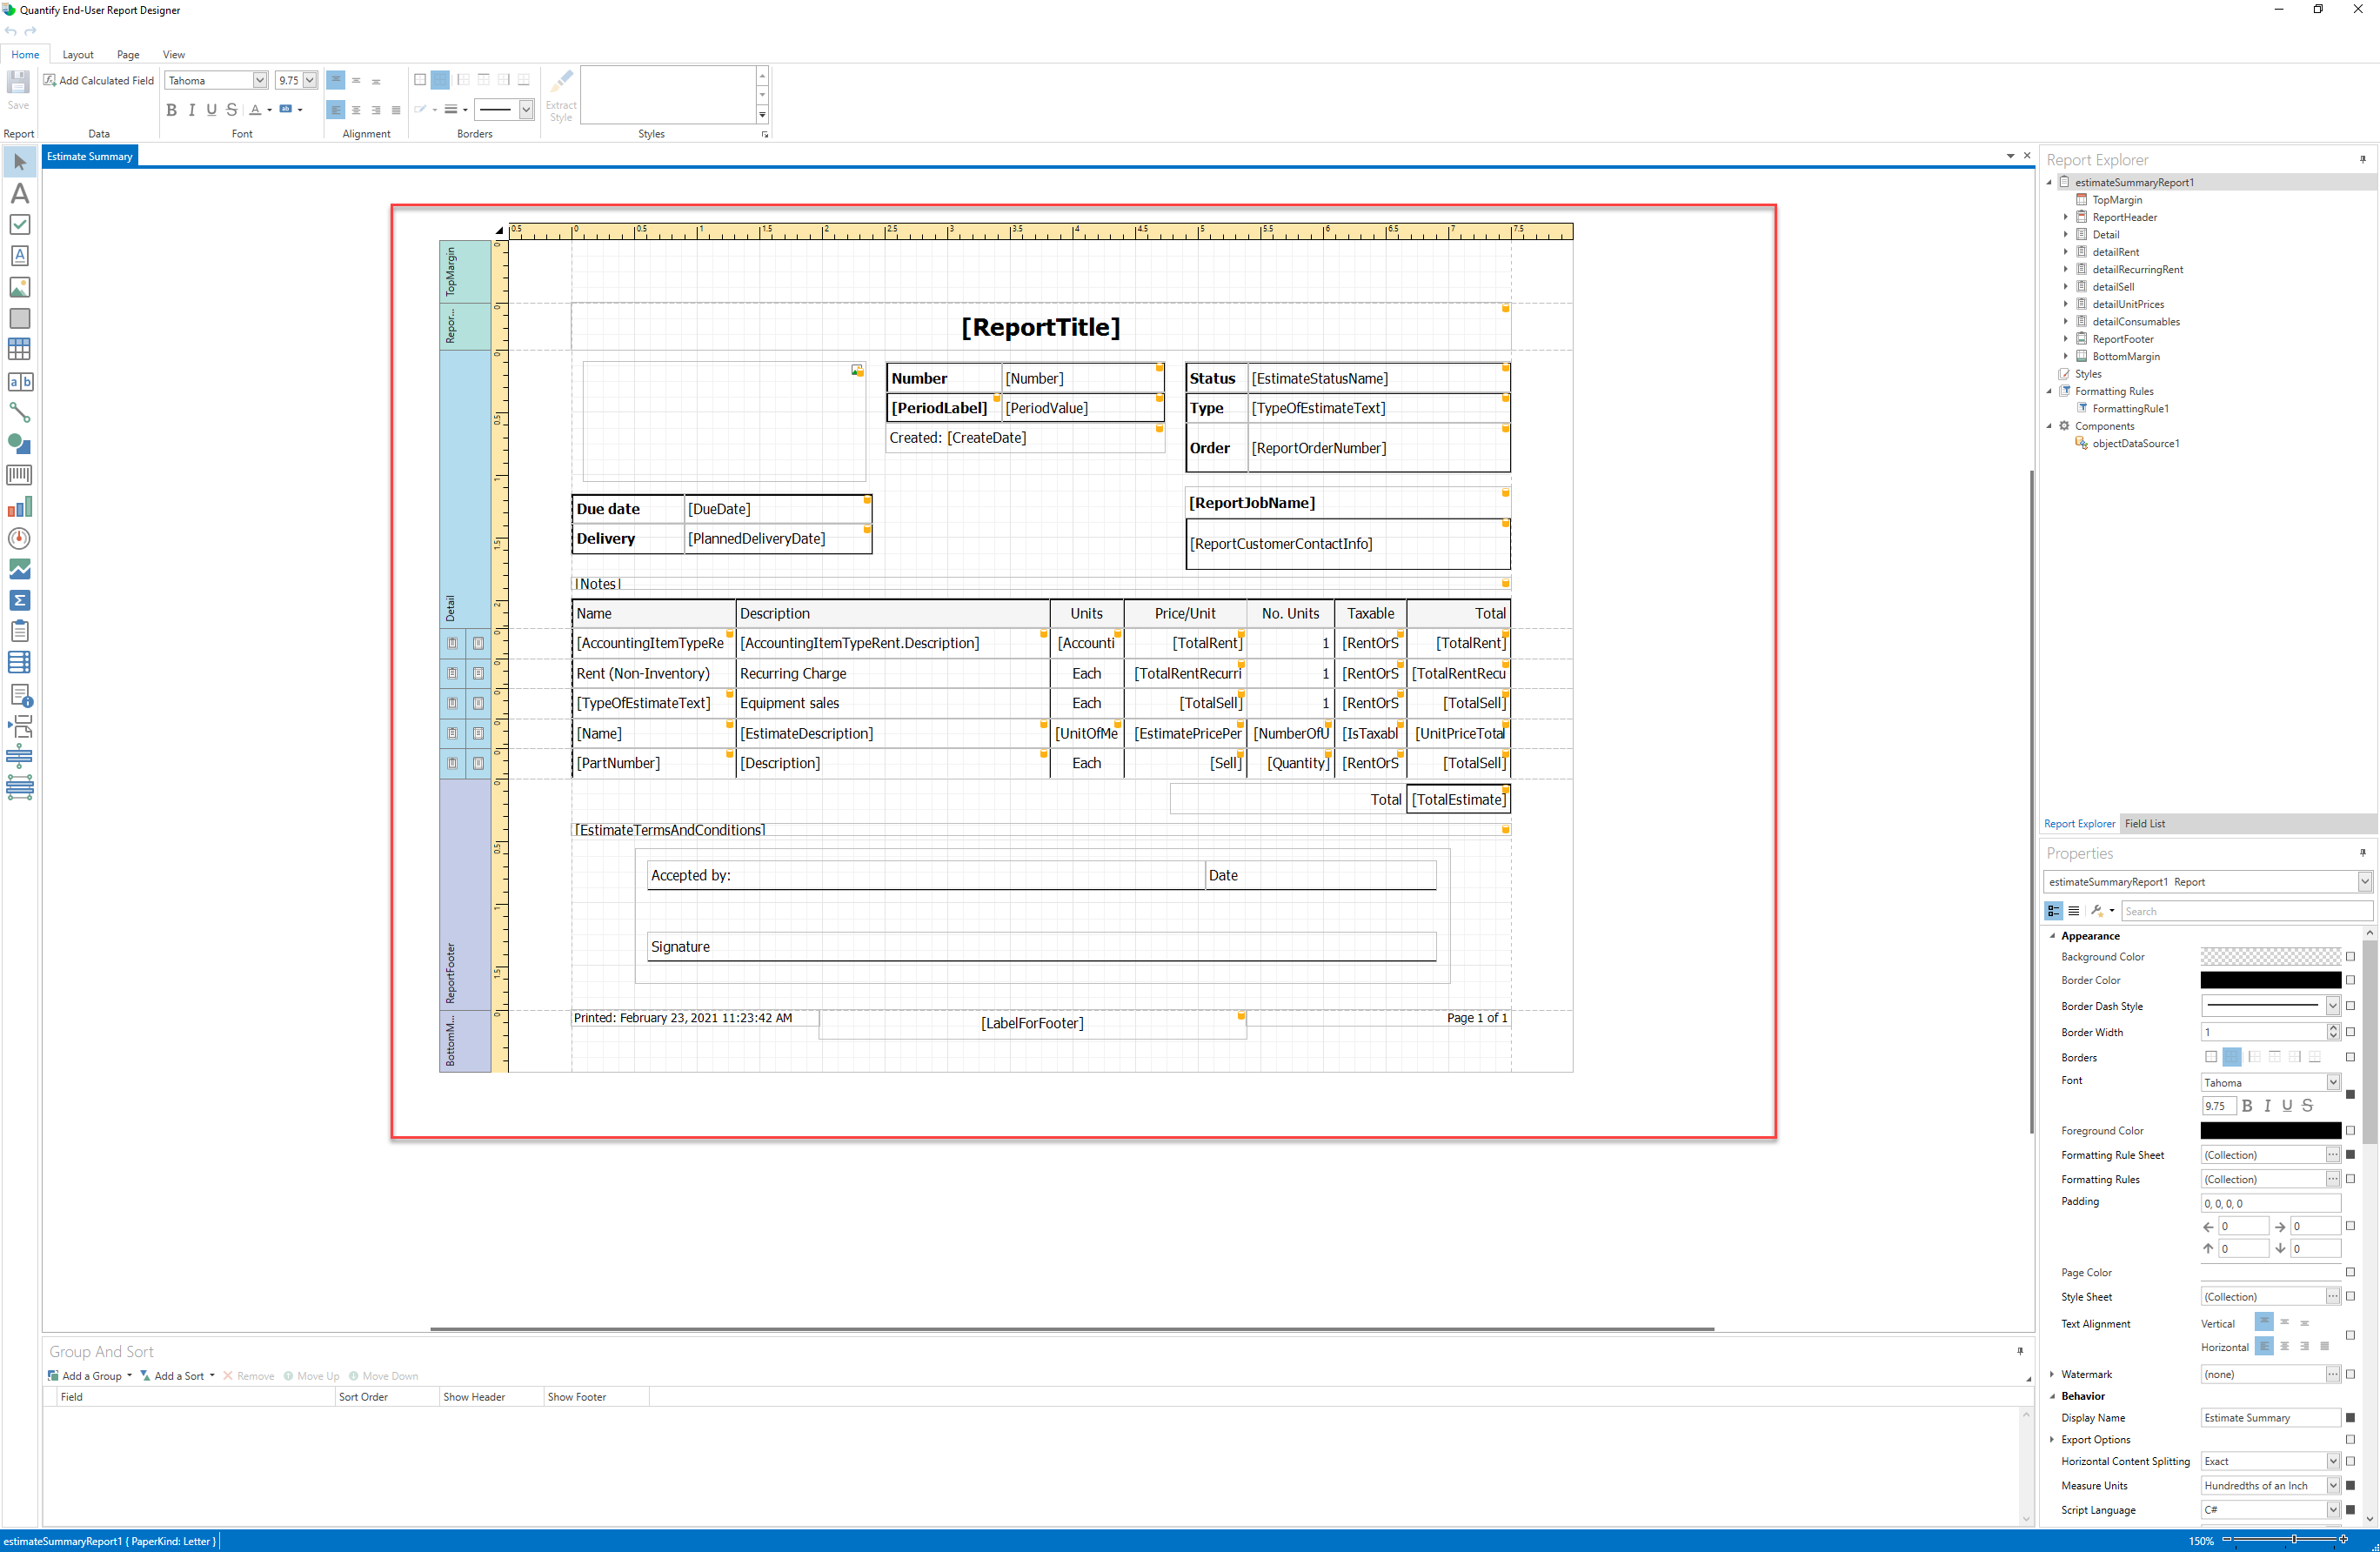
When you select to modify an orignal report or edit a modifed report you will be taken to designer screen.
The design surface displays a report's structure and contents. You can
- Use the tools on the Report Designer's panels to design the report:
- Access the report's data source schema in the Field List;
- Drop report controls from the Toolbox to the design surface;
- Use the Ribbon toolbar and Property Grid to set up the report controls;
- Access the report's elements in the Report Explorer;
- Use the Group and Sort panel to manage the report's group and sort settings.
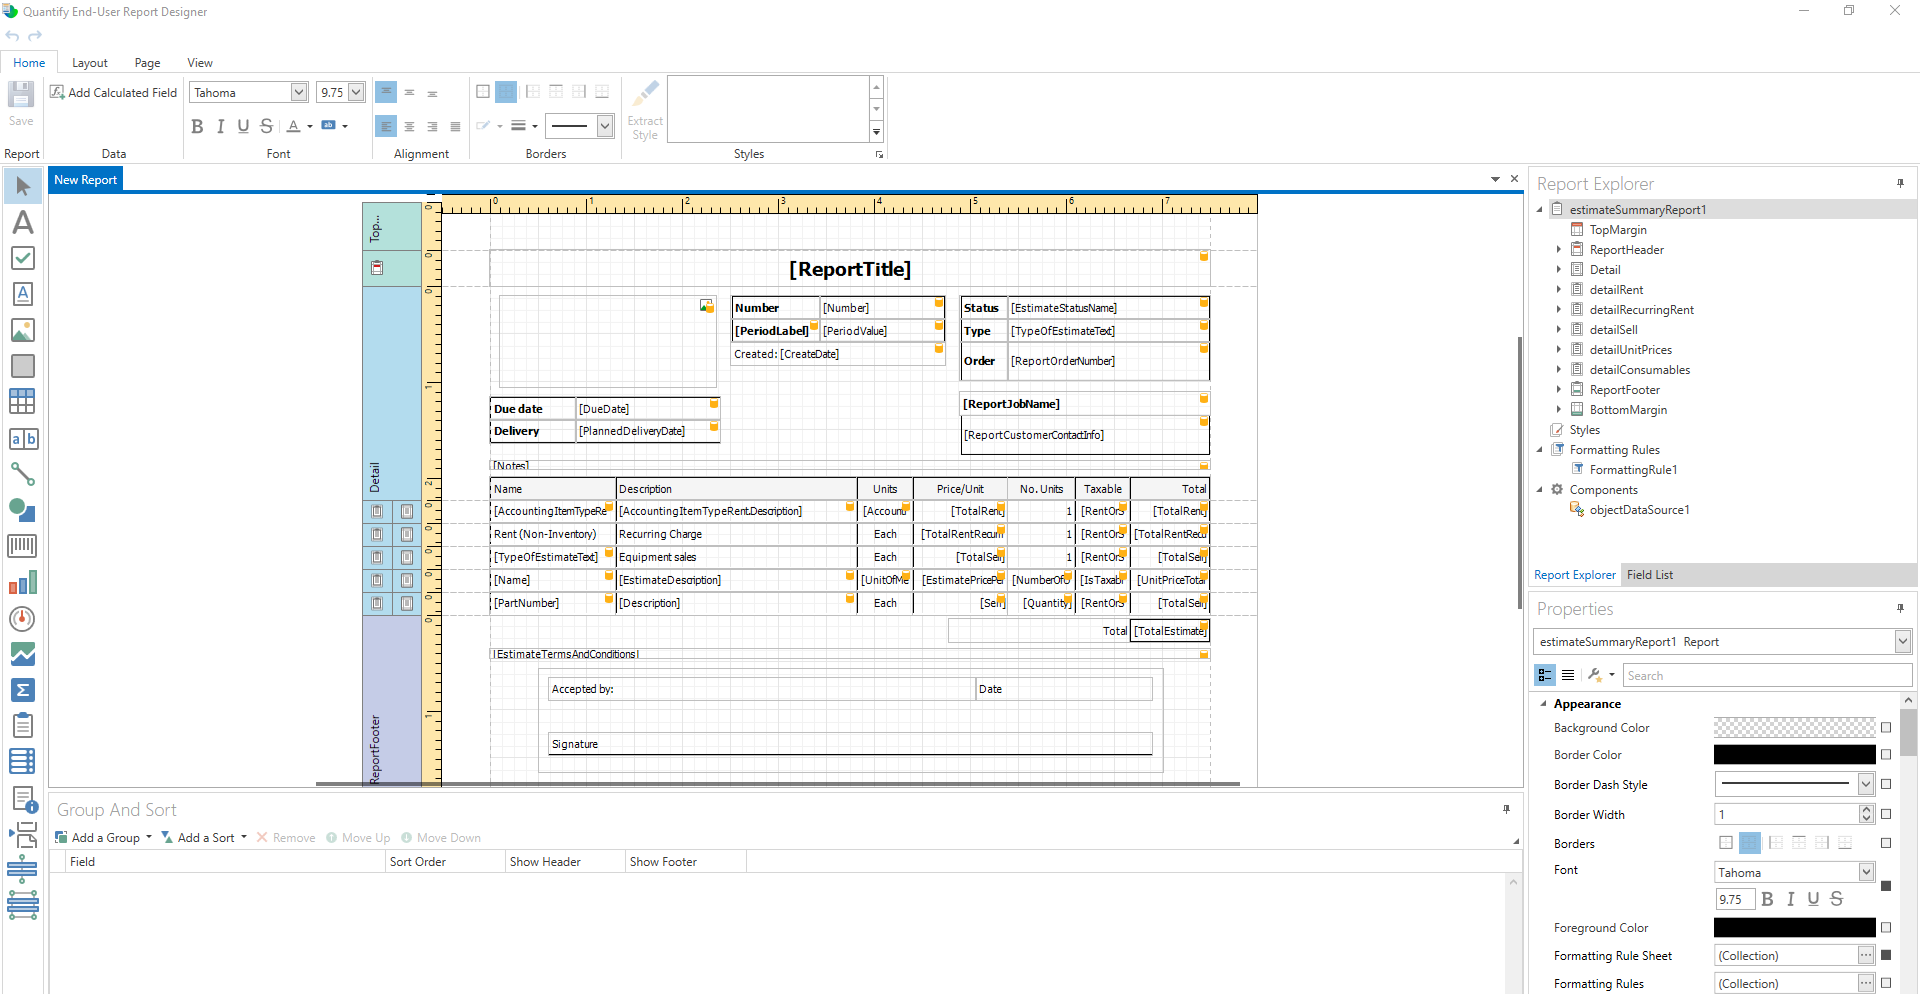
Design Surface
At the center is the Design Surface, this is where you will customise the selected report and drag tools from the toolbar on the left.
Tools
The Toolbox section is where you can find tools that allow for the modification of the report. Here you can add a label so the customer has an area to sign the report or a picture box which you can use to add the company logo.
To drag a tool to the design page, click on the required tool and click and drag where you’d like the tool to go.
For more information see the Toolbox section
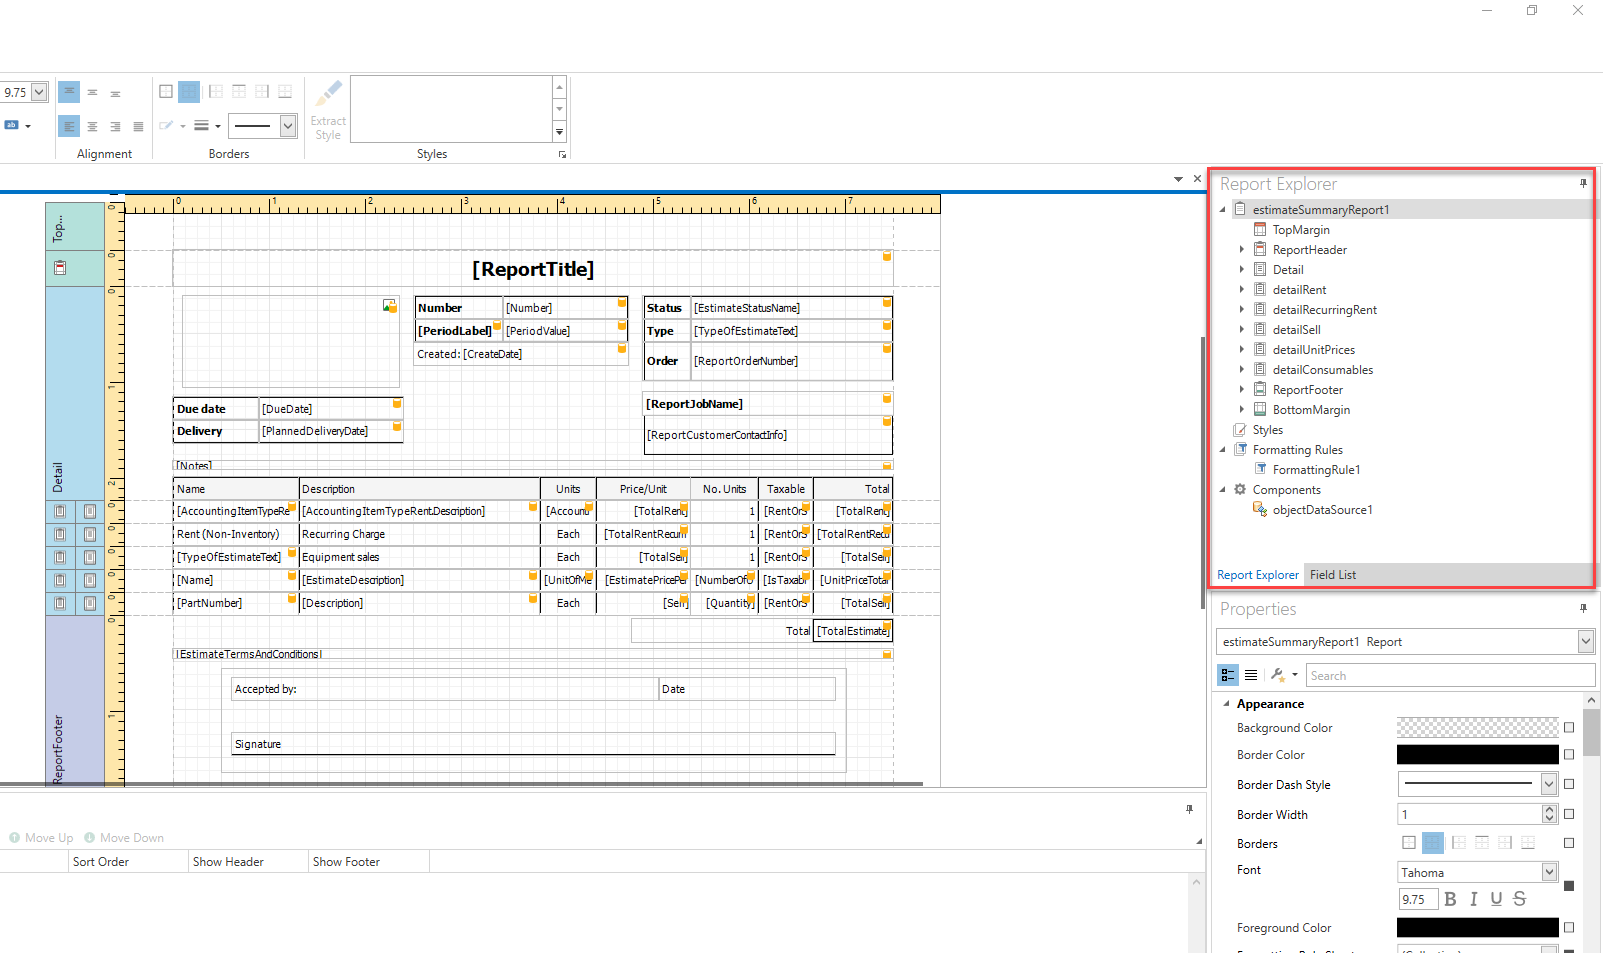
Report Explorer
The Report Explorer reflects a report's structure in a tree-like form providing easy access to report elements. Additionally, the Report Explorer contains the Components node, which displays non-visual report components such as data objects created when binding a report to a data source. You can also use the Report Explorer to manage styles and formatting rules available for a report.
Field list
If you select the Field List tab in the Report Explorer you can see a list of available fields in the report. This panel displays the schema of a report's data sources. You can right-click a data source item (see below) to access its settings. This details what information will be pulled from Quantify.
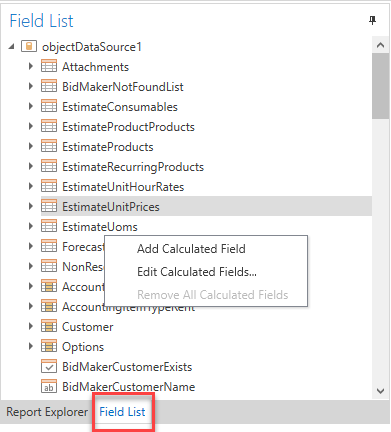
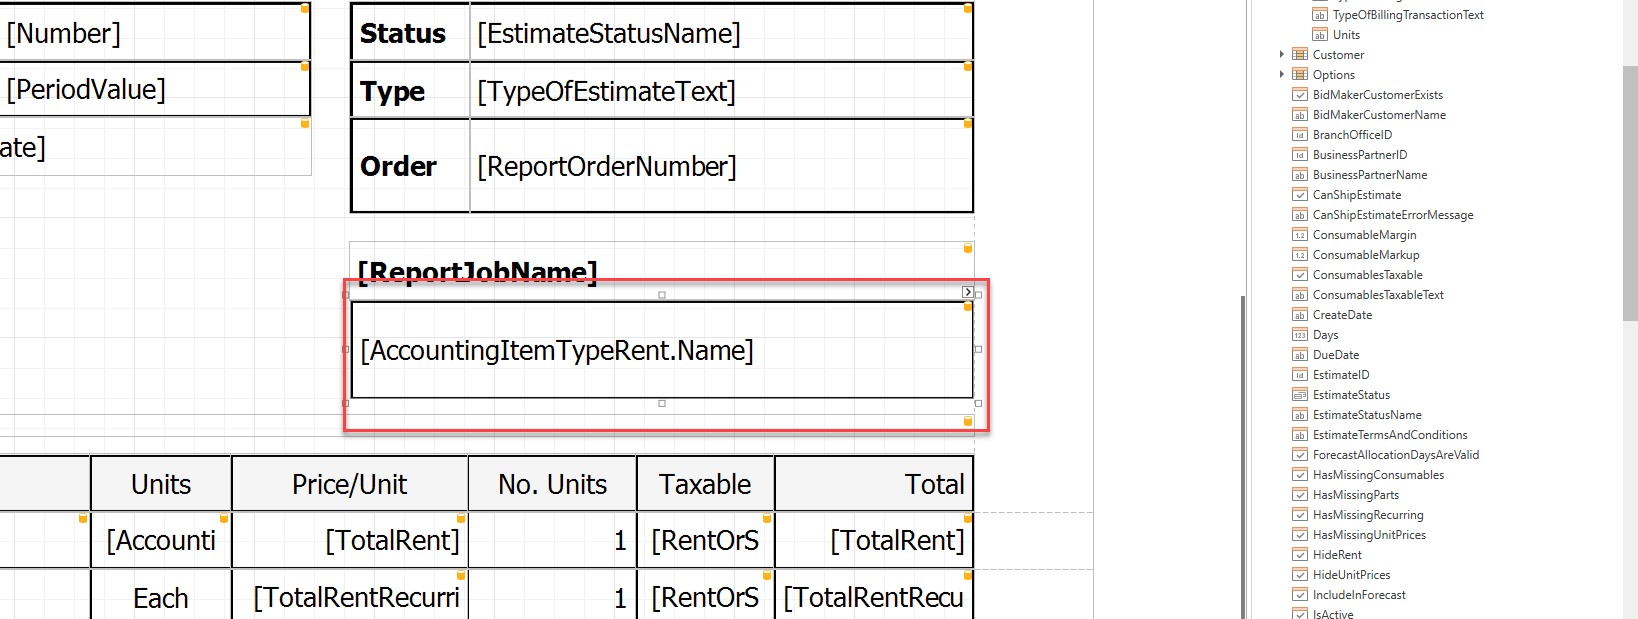
Dropping a field onto a report's surface creates a new report control bound to a corresponding field.
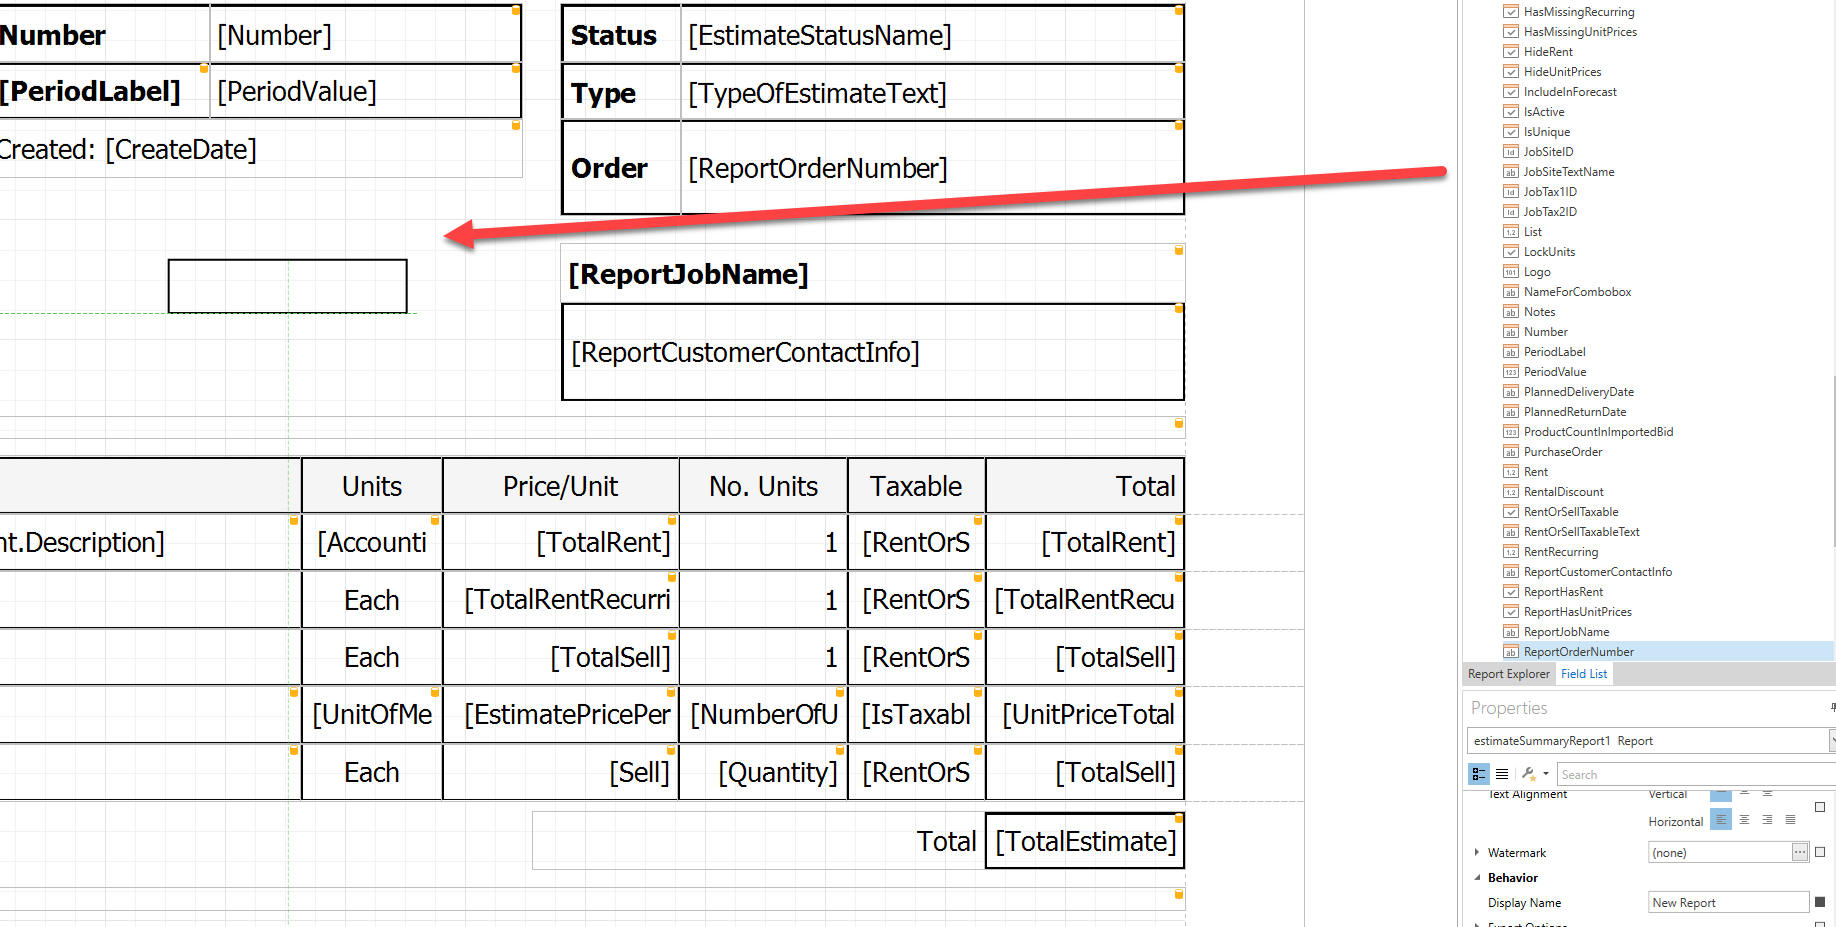
This will change the ReportCustomerContactInfo field to the appropriate field.